

In the world of digital advertising, a Looker Studio Facebook Ad Analysis Dashboard is your go-to ally. Crafted for small businesses and startups, it goes beyond numbers—it's your tool for smarter decisions, elevated strategies, and a fresh perspective on Facebook campaigns.
⦿ Inadequate Ad Performance Insight: Existing analytics tools fall short in providing comprehensive insights into the performance of Facebook ad campaigns, which makes advertisers struggle to make informed decisions, leading to sub-optimal strategies and potential budget wastage.
⦿ Complex Campaign Monitoring: The complexity of monitoring multiple campaigns in real-time hinders advertisers’ ability to react promptly to changing dynamics.
⦿ Limited Audience Understanding: Difficulty in understanding how different demographics respond to ads, making crafting targeted campaigns becomes challenging, potentially leading to ineffective ad spend.
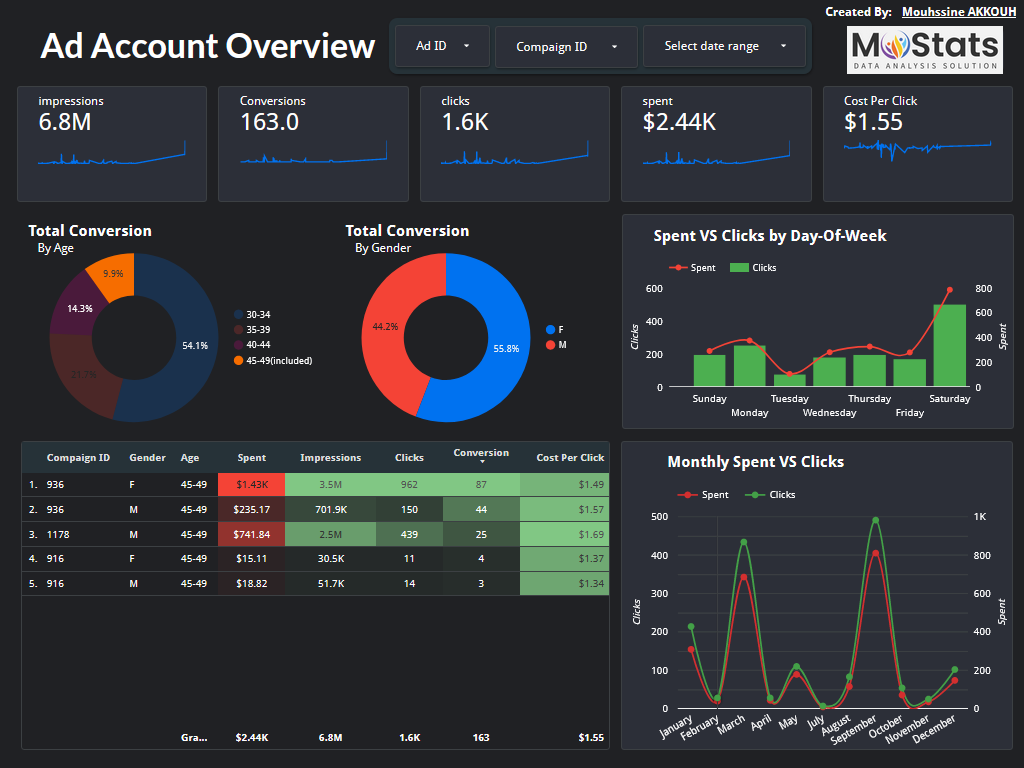
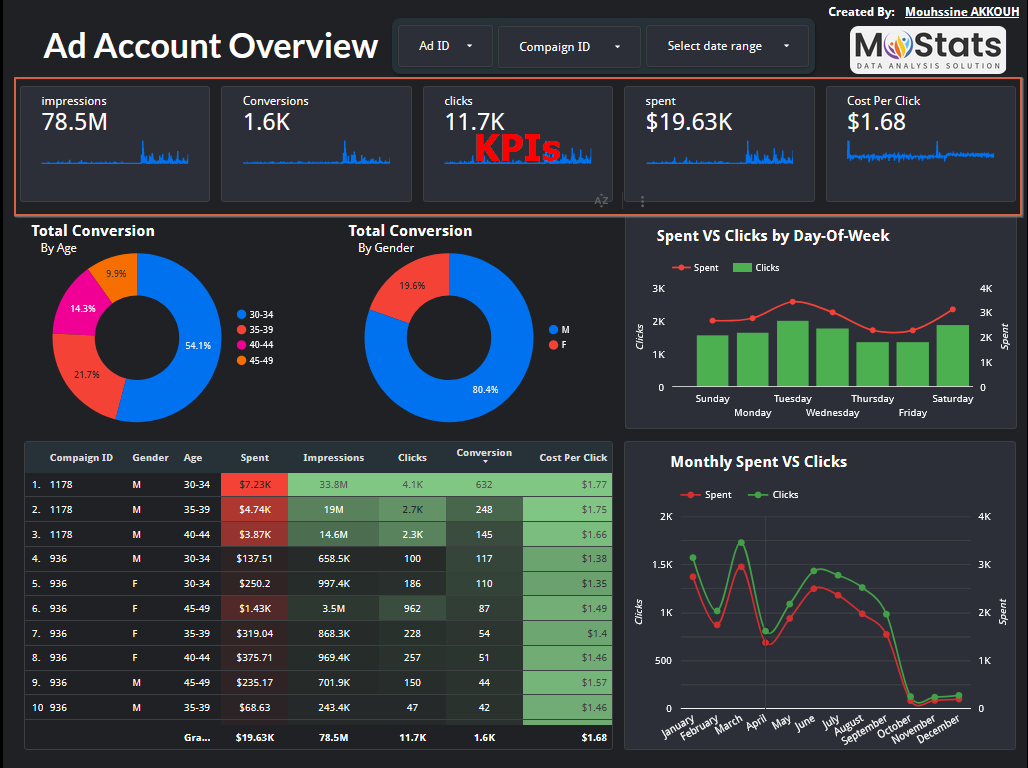
⦿ Comprehensive Campaign Evaluation: Provide advertisers with a holistic view of key performance indicators, including impressions, conversions, clicks, spending, and cost per click, leading to a streamlined decision-making and a consolidated analysis platform for efficient campaign evaluation.
⦿ Real-Time Monitoring and Reaction: Ensure that advertisers have access to up-to-date data for timely decision-making and dynamic campaign management, in order to increase responsiveness, allowing advertisers to adapt quickly to changing campaign dynamics.
⦿ Enhanced Audience Insights: Utilize demographic charts to offer detailed insights into age and gender responses to ads. Empower advertisers to craft more targeted campaigns and optimizing ad spend for maximum impact.
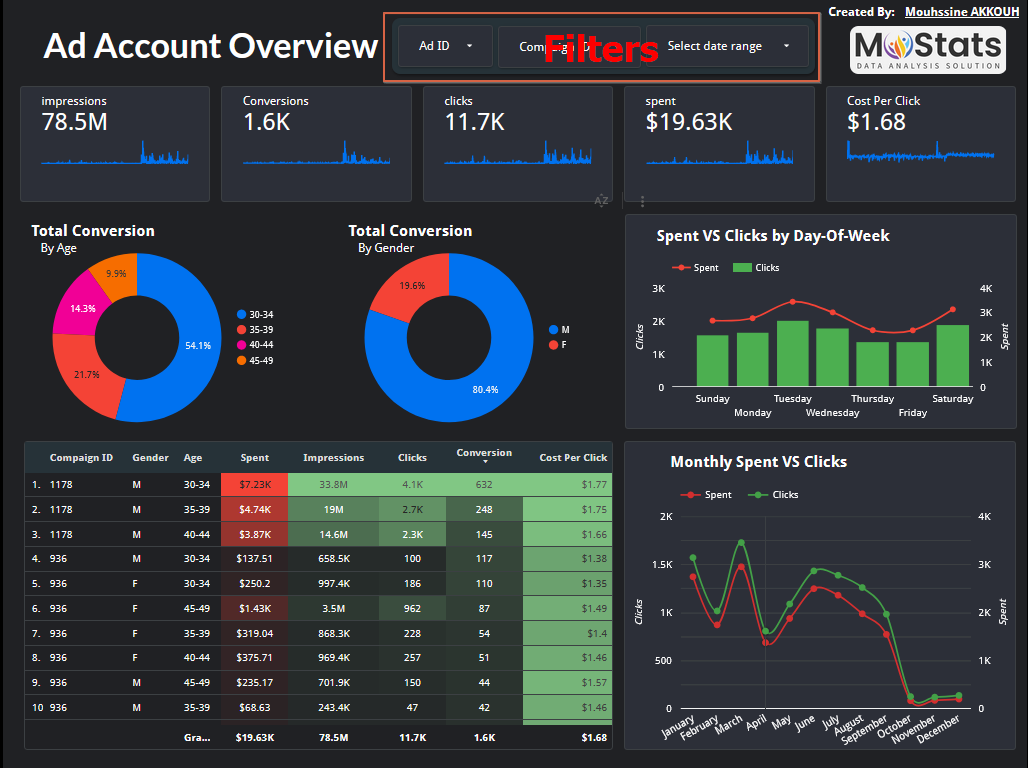
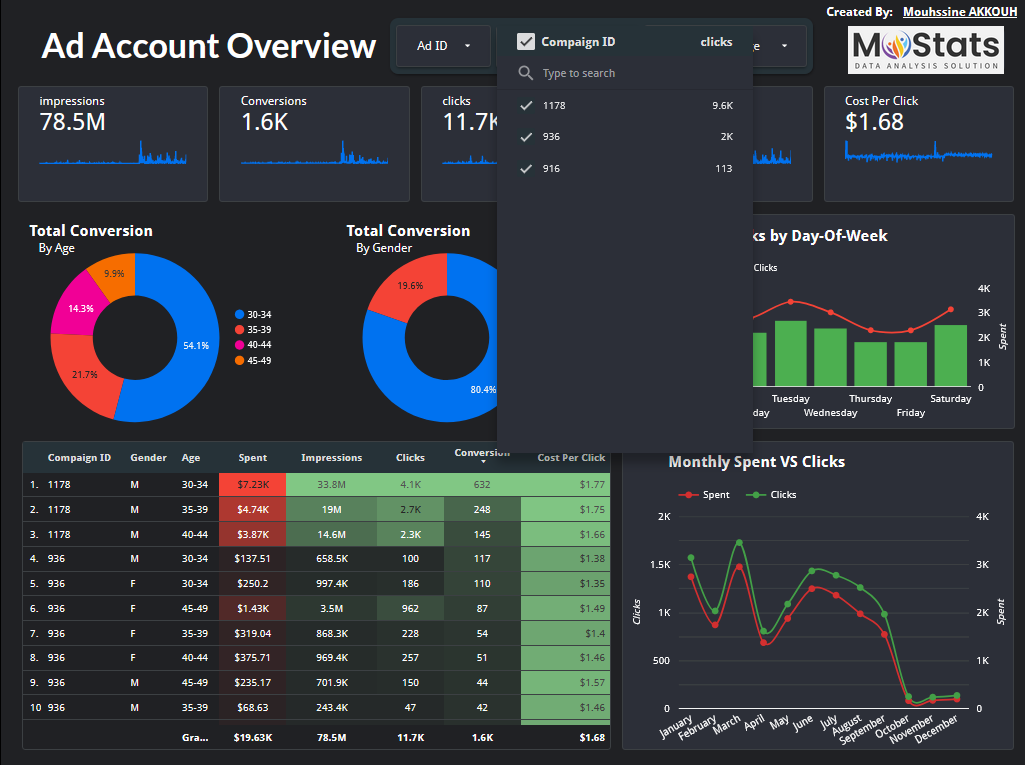
With the following tailored filters, we can focus on specific time frames and provide a personalized approach for campaign-specific details. These filters ensure that the analysis is finely tuned to our unique requirements.
Date Range Filter: We can use it to select a specific date range for focused analysis, and navigate insights with time precision.
Campaign and Ad ID Filters: Filter by campaign and ad ID for targeted insights, to ensure a personalized approach to campaign-specific details.
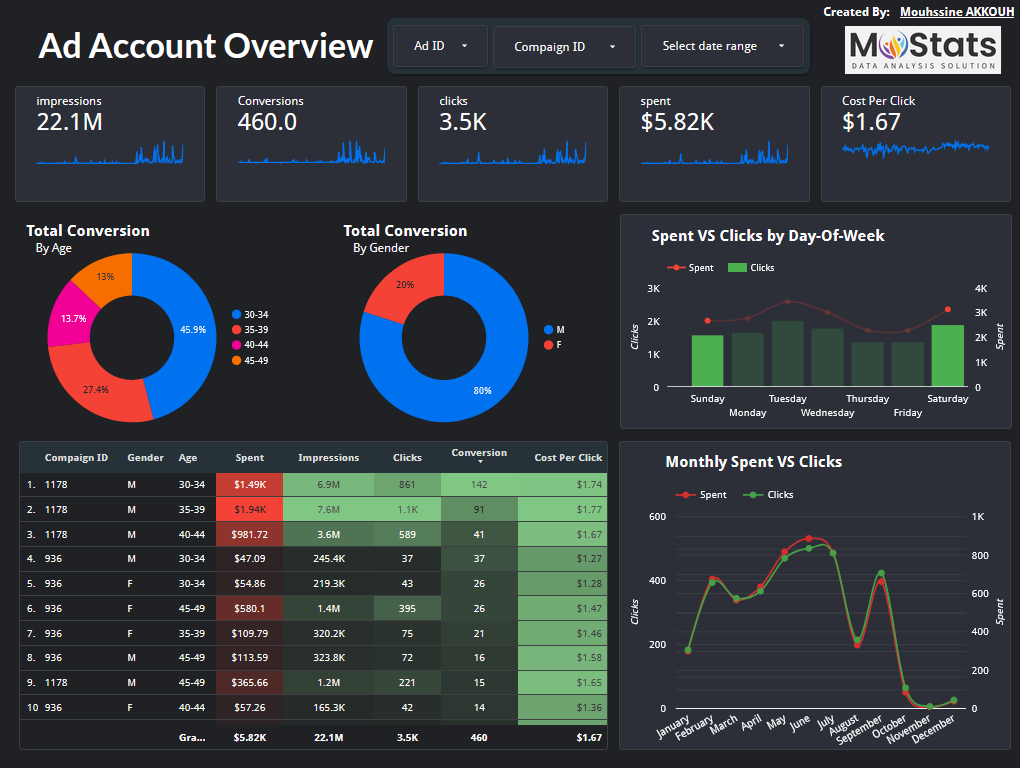
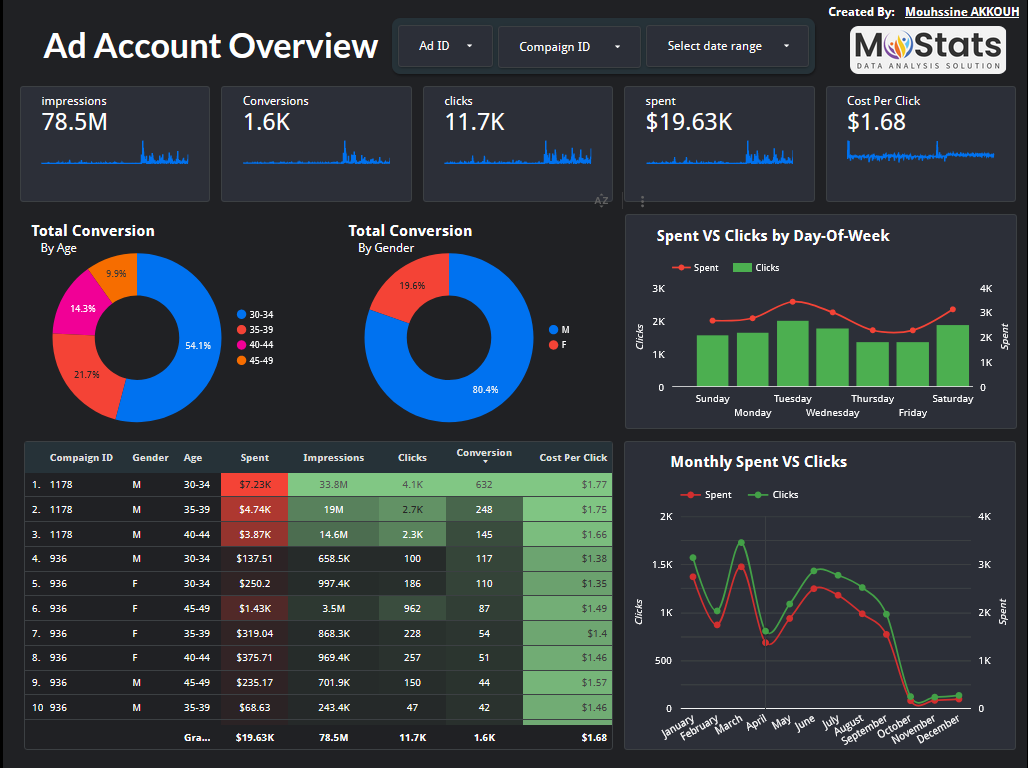
KPIs are used to delve into the heart of campaign performance. From tracking spending and impressions to understanding conversions and cost per click, these metrics form the backbone of efficient decision-making. Consolidate, comprehend, and act with precision.
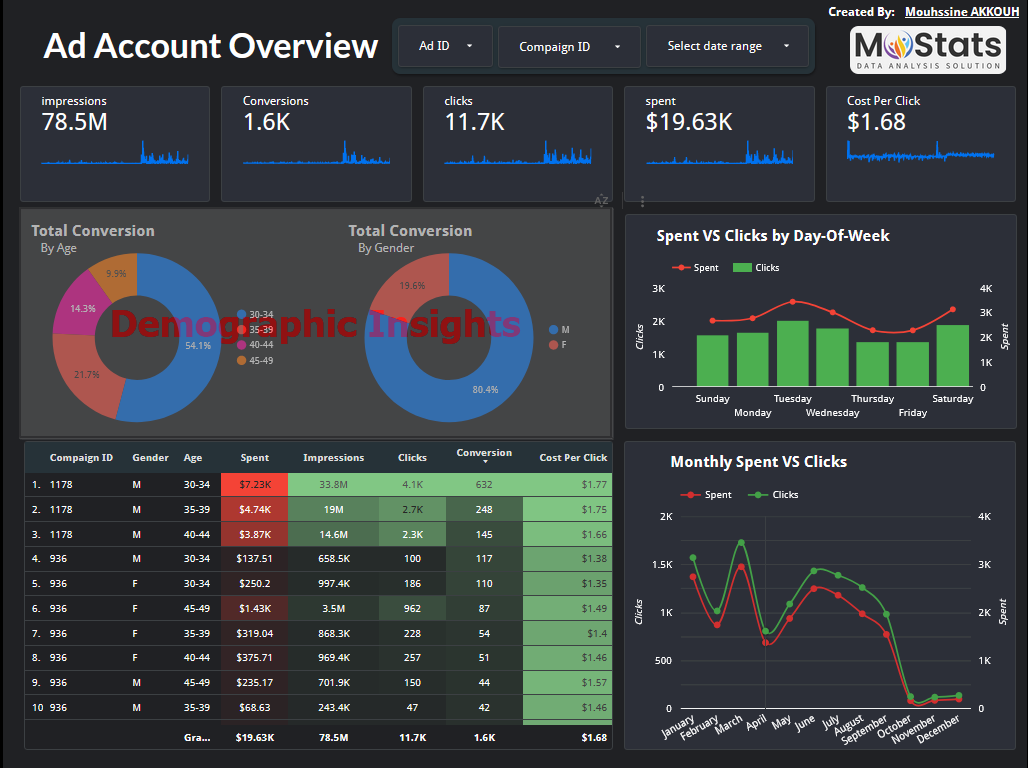
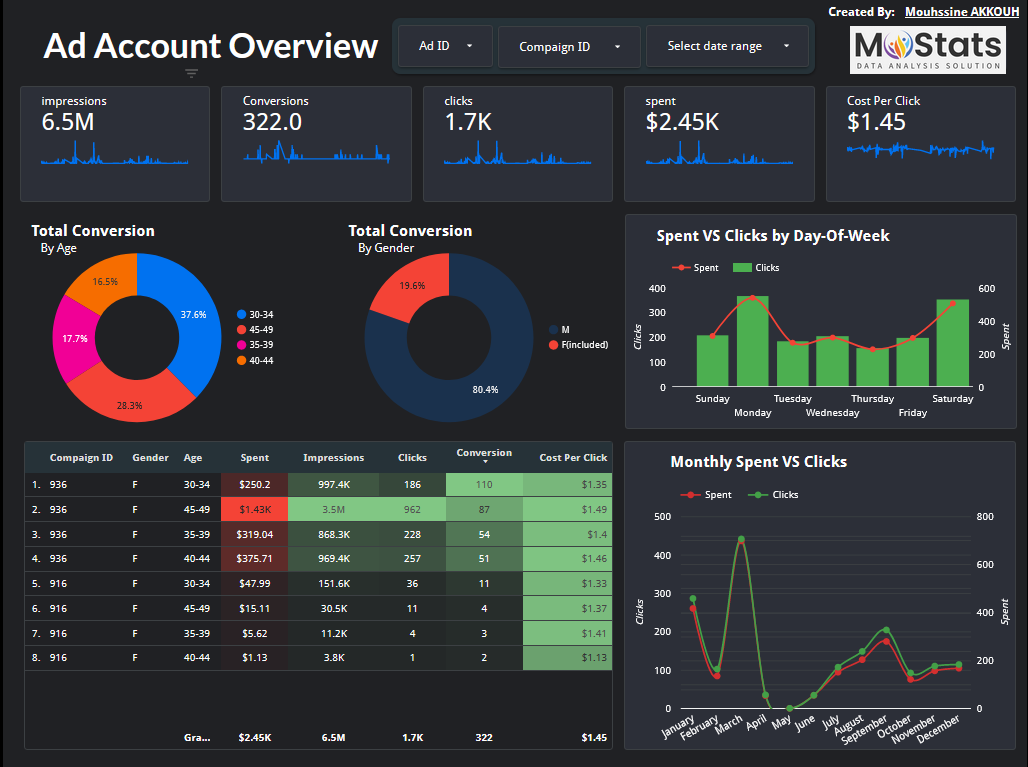
Understanding the audience is key to crafting targeted campaigns. The two demographic donut charts for total conversions by age groups and gender provide nuanced insights. Identify responsive segments and optimize the ad spend for maximum impact, fostering a connection with the audience.
Timing is everything in advertising. The day-of-week combo chart help in discover the most impactful days, optimizing budget allocation. The monthly trends combo chart offers a broader perspective, revealing long-term patterns and facilitating proactive adjustments for sustained success.
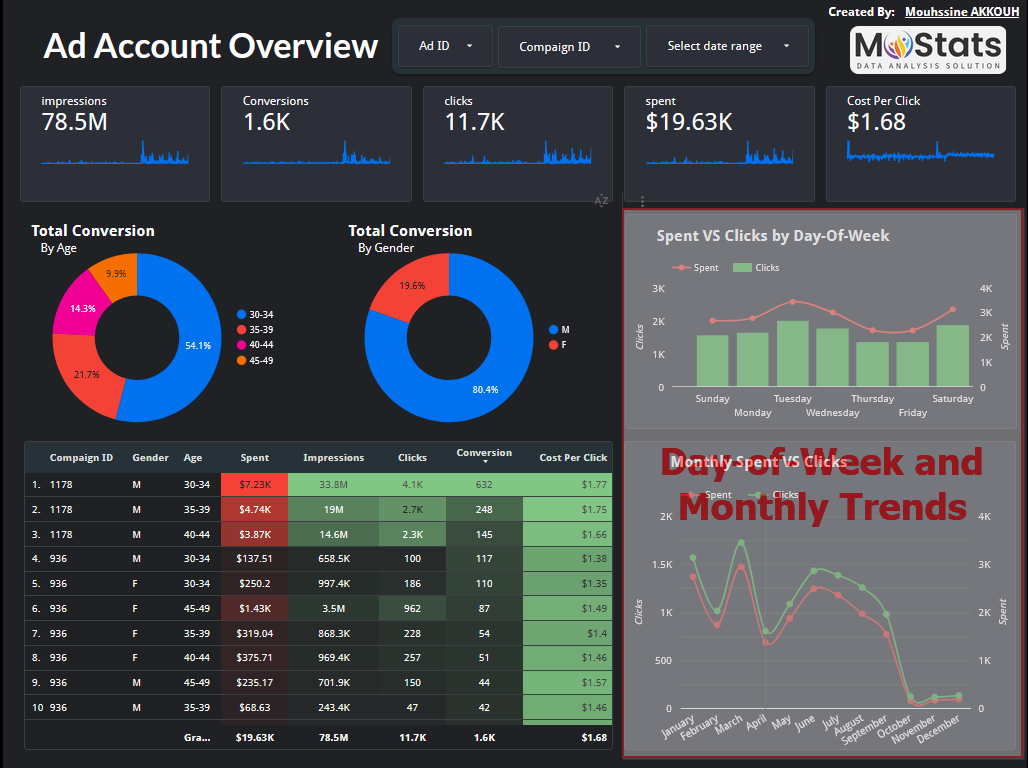
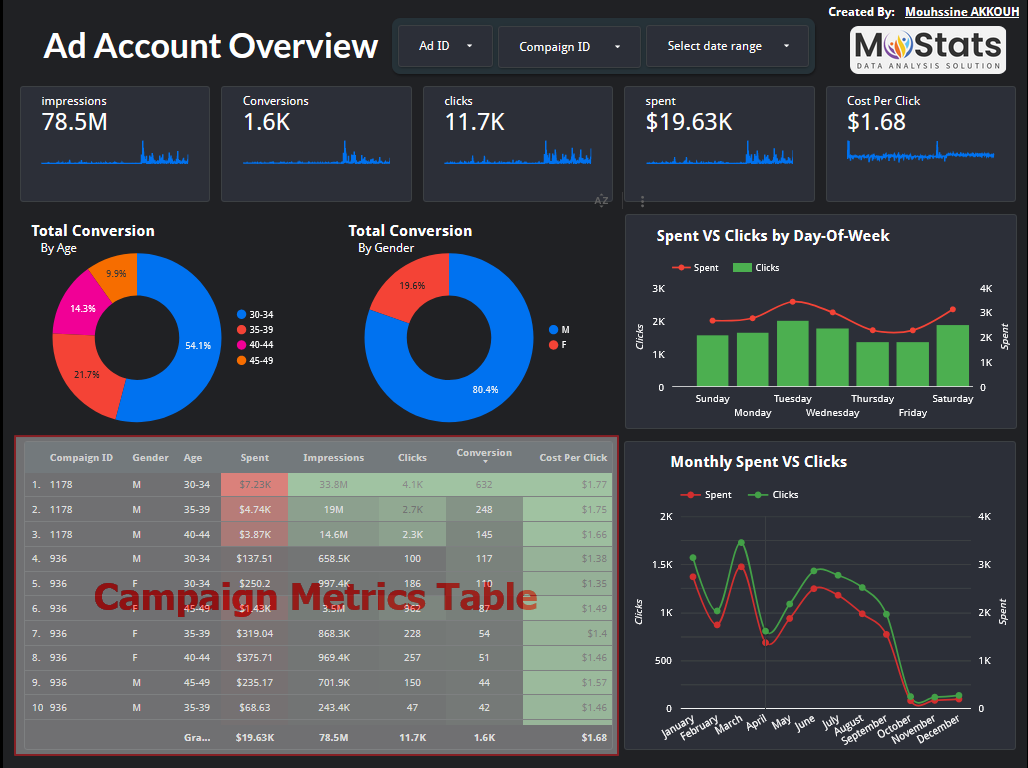
Dive into the details with the in-depth campaign metrics table. Featuring spent, impressions, clicks, conversions, and cost per click, this table offers a side-by-side comparison of campaigns by gender and age.
From precision decision-making to dynamic ad-hoc exploration, this dashboard is a necessary tool for optimizing your advertising strategy.
✔️ Identify top-performing campaigns and allocate budget effectively.
✔️ Fine-tune strategies based on real-time data updates.
✔️ Evaluate ongoing campaigns with up-to-the-minute data.
✔️ Utilize demographic charts for age groups and gender to tailor content.
✔️ Optimize ad spend by understanding the preferences of different segments.
✔️ Uncover nuanced insights into the effectiveness of different campaigns.
✔️ Discover the most impactful days for campaigns.
✔️ Understand long-term trends for proactive adjustments.
✔️ Ensure budget optimization for the best results.
✔️ Make data-driven decisions to enhance cost-effectiveness.
✔️ Uncover unexpected insights for agile and responsive decision-making.
✔️ Adapt strategies quickly based on emerging trends.
Use the dashboard to get instant insights, apply filters and select different date ranges
Explore how businesses can leverage our Looker Studio services to create Facebook Ad Analysis Dashboard to overcome challenges, optimize strategies, and achieve remarkable success.
❌ Problem: A fashion retailer faced declining engagement and conversions, unsure of the content resonating with their audience.
✔️ Solution: Utilizing the dashboard's demographic insights, they can craft targeted content based on age and gender preferences, revitalizing audience engagement and boosting conversions.
❌ Problem: A tech startup found it challenging to compete effectively in a crowded market, unsure of the effectiveness of their ad spend.
✔️ Solution: Analyzing cost per click across campaigns and ads, they can identify high-performing strategies, optimizing their budget for maximum ROI and gaining a competitive edge.
❌ Problem: A subscription service faced challenges in customer segmentation, leading to generic campaigns that failed to resonate.
✔️ Solution: Utilizing demographic charts, they refined customer segmentation, tailoring campaigns to specific age groups and genders, resulting in higher engagement and retention.
❌ Problem: A diverse service provider struggled to create campaigns that resonated with a broad audience.
✔️ Solution: The dashboard's demographic insights enabled them to tailor campaigns to the preferences of various age groups and genders, improving overall campaign effectiveness.
❌ Problem: An international brand struggled with inefficient budget allocation across diverse regions and demographics.
✔️ Solution: By leveraging the dashboard's day-of-week and monthly trends, they optimized budget allocation for specific days and tailored campaigns to resonate with regional preferences.
❌ Problem: A seasonal retailer struggled to adapt their advertising strategy to emerging trends and unexpected shifts in consumer behavior.
✔️ Solution: Through dynamic ad-hoc exploration, they can quickly identify and capitalize on emerging trends, ensuring their campaigns remained relevant and impactful.
❌ Problem: A niche product struggled to reach its target audience within a limited marketing budget.
✔️ Solution: The dashboard's precise decision-making capabilities allowed for targeted spending, ensuring the product reached the right audience, leading to increased conversions.
❌ Problem: A long-established brand sought ways to improve the overall performance of their ongoing campaigns.
✔️ Solution: Utilizing holistic campaign performance analysis, they gained insights into campaign nuances, enabling them to refine strategies and consistently improve long-term performance.
In today’s digital age, data-driven decision-making is essential for advertising success. If you’re a small business or startup seeking to elevate your Facebook advertising strategy and maximize your ROI, you’ve arrived at the perfect solution. We’re thrilled to introduce our bespoke Looker Studio Facebook Ad Analysis Dashboard – a potent and interactive tool designed to revolutionize your approach to ad campaigns.
Motivation for a New Solution
Monitoring Facebook ads can be a complex task, often falling short of providing the in-depth details advertisers need. The Looker Studio Facebook Ad Analysis Dashboard is the solution you’ve been waiting for. It’s designed to address the challenges of Facebook ads and offer you a more detailed, user-friendly, and interactive alternative.
What Our Dashboard Offers
Our Looker Studio dashboard isn’t just another analytics tool; it’s your gateway to valuable insights and informed decision-making. Let’s explore the diffrent ways this dashboard can reshape your advertising strategy:
Tailor-Made Insights: Customize Your Analysis Our dashboard includes three flexible filters – date range, campaign ID, and ad ID – enabling you to fine-tune your analysis. This customization ensures that your data aligns seamlessly with your unique advertising needs.
Real-Time Data Updates Outdated information is a thing of the past. Our dashboard updates in real-time, ensuring you always have access to the latest data, a crucial feature for staying ahead in your campaigns.
Holistic Campaign Evaluation No more juggling spreadsheets. The dashboard offers key performance indicators (KPIs) like impressions, conversions, clicks, spending, and cost per click in an easily digestible format.
Audience Insights Utilize demographic donut charts to identify which age groups and genders respond most favorably to your ads. This critical insight allows you to craft more targeted campaigns.
Day-of-Week Optimization Discover the most profitable days of the week for your campaigns. Allocate your budget intelligently for maximum impact.
Long-Term Trends Understand how your campaigns are performing over time with the monthly line chart. Identify trends and seasonality to make proactive adjustments.
Comparative Analysis Easily compare the performance of different campaigns or ads within the table view. This feature identifies top-performing assets and areas needing improvement.
Conversion Funnel Analysis Drill down from impressions to conversions within the table view to identify where your funnel might be leaking, helping you streamline your strategy.
Cost-Effective Decision Making Calculate the cost per click across all campaigns and ads, ensuring you’re optimizing your budget for the best results.
Ad-Hoc Exploration Empower yourself to explore ad-hoc questions and scenarios with cross-filtering. This feature enables you to uncover insights and make data-driven decisions on the fly.
Our Looker Studio Facebook Ad Analysis Dashboard isn’t just a tool; it’s a catalyst for success in today’s digital advertising landscape. Whether you’re managing a single campaign or juggling multiple, it empowers you to make informed decisions and achieve your advertising goals.
If you’re ready to supercharge your Facebook advertising efforts, we’re here to help. Contact us today to create a customized dashboard that aligns with your unique requirements and delivers actionable insights. Don’t settle for guesswork when it comes to your advertising. Embrace data-driven decisions and turn your advertising campaigns into success stories!
Your data deserves better, and our Looker Studio dashboard is here to deliver it. Get in touch today to embark on your data-driven journey.