
1. Data Understanding and Churn Visualization
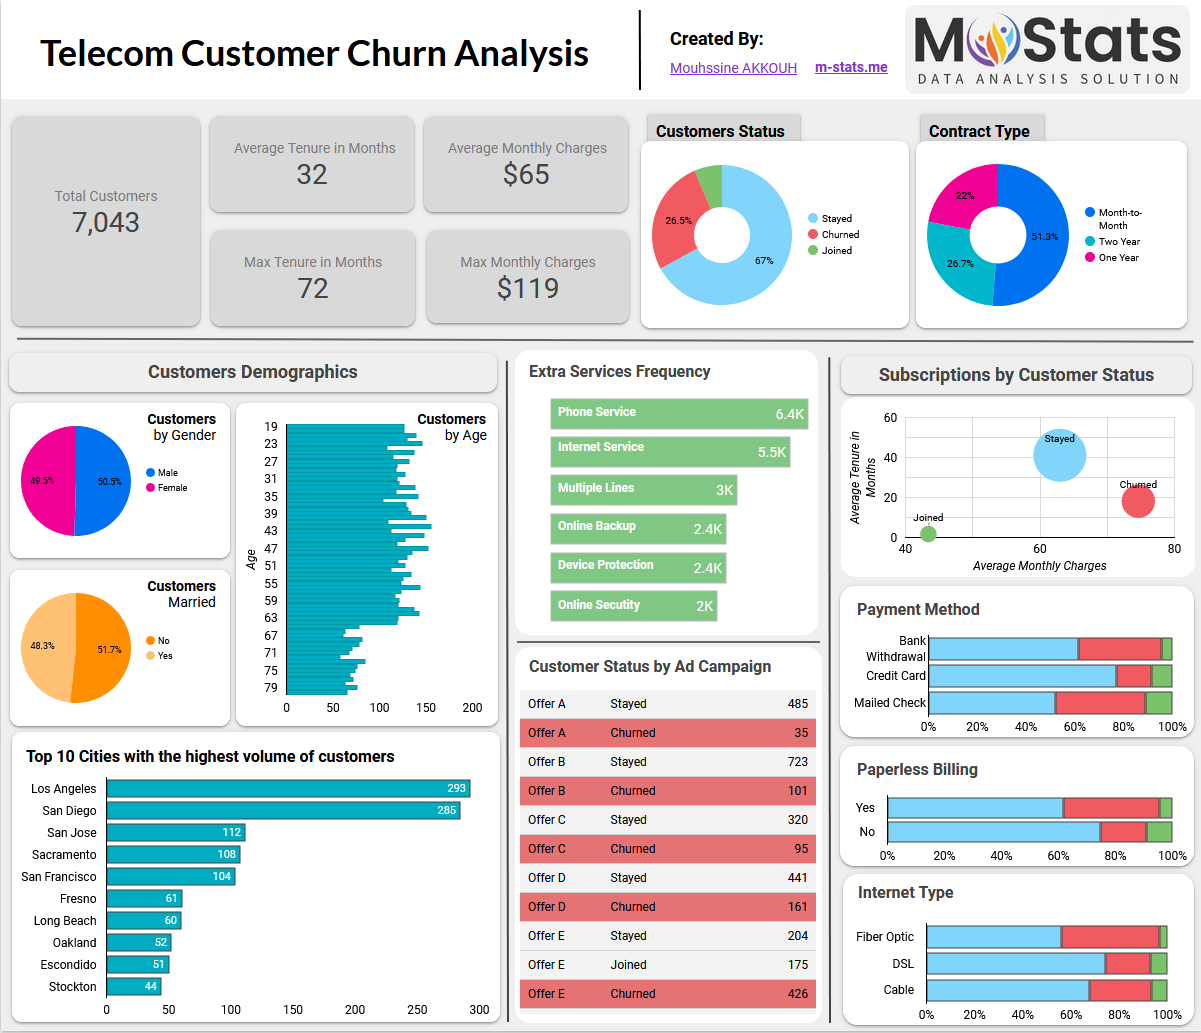
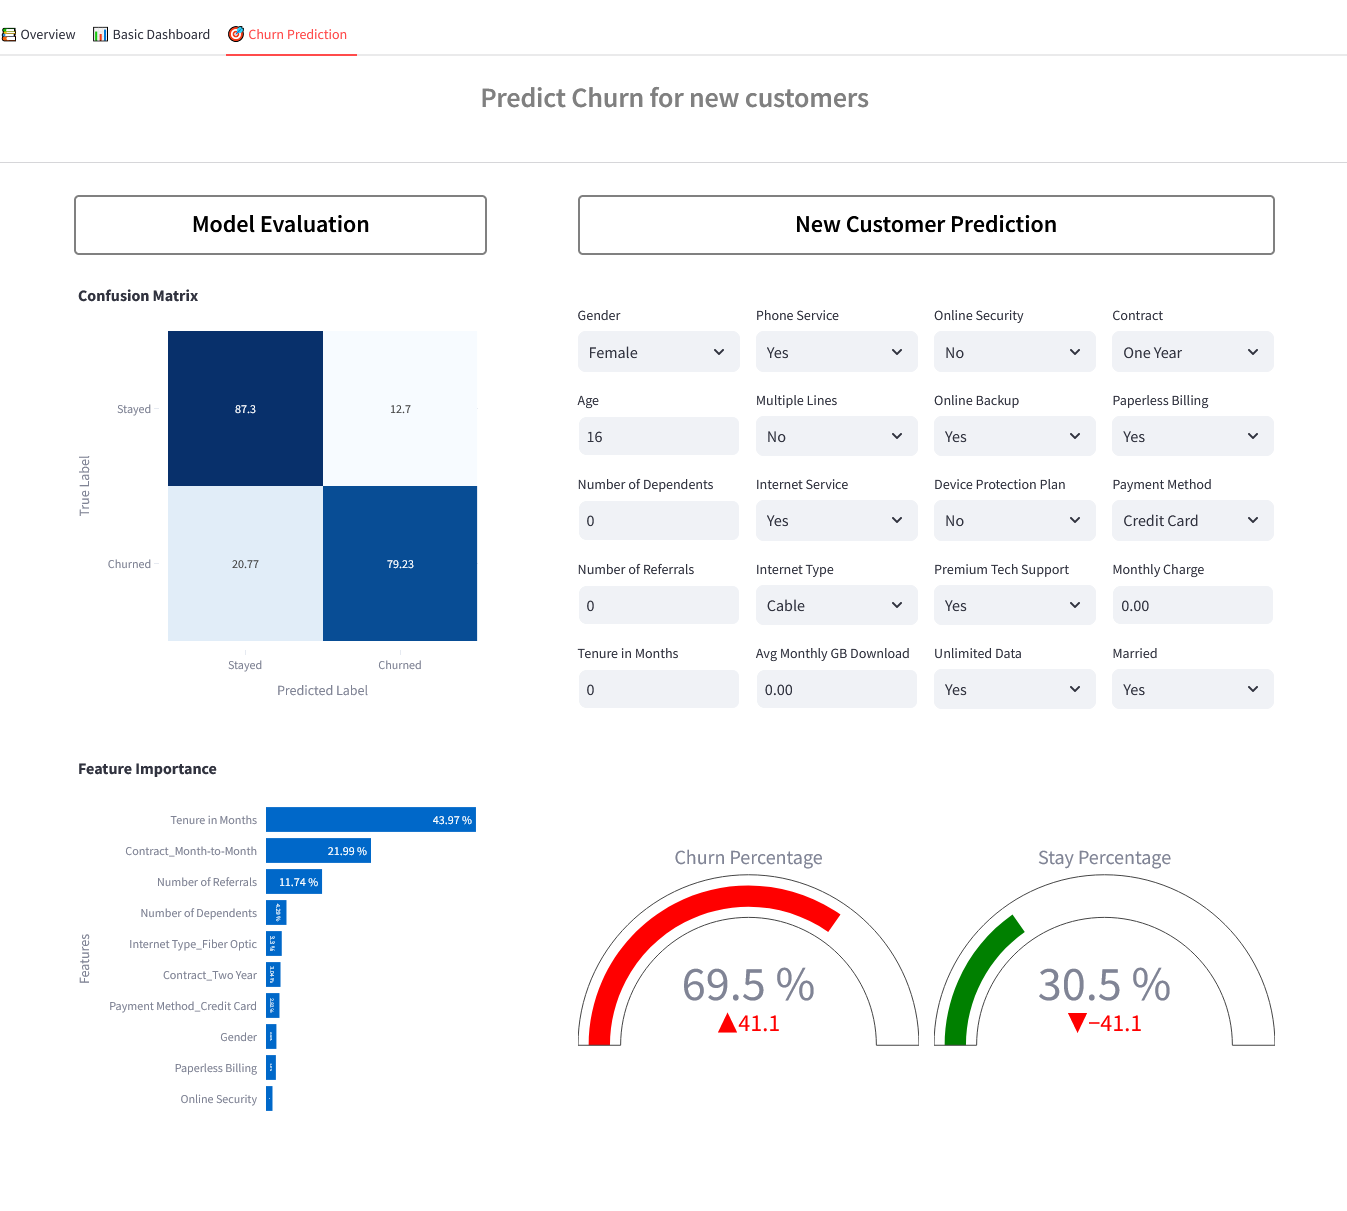
In the Tab named "Basic Dashboard", we can explore our customers' data using a fully interactive dashboard.
- Interactive Exploration: Dive into your data through interactive visualizations, demystifying customer churn patterns.
- Filter Capabilities: Utilize filters to assess the impact of specific campaigns, customer groups, and contractual elements on churn behaviors.
- Granular Insights: Unravel the complexities of contract types, explore customer demographics, and understand the effectiveness of advertising with a click.


