

Our Relationship Research Dashboard was built as an interactive and user-friendly tool to help the discovery of insights from a study investigating romantic relationship behaviors and the impact of the family environment
Navigating the intricate terrain of romantic relationships and family influence presented several challenges during the research:
⦿ Complex Dynamics: Understanding the multifaceted dynamics between partners and the influence of family environments is inherently complex.
⦿ Data Overload: Managing and interpreting survey data related to romantic relationships can be overwhelming without a centralized and user-friendly platform.
⦿ Nuanced Comparisons: Identifying nuanced patterns and relationships within the data, especially in terms of demographics and relationship history, required a comprehensive approach.
To address these challenges, our research aimed to achieve the following objectives:
⦿ Centralized Insights: Develop a centralized dashboard to simplify access to survey results, providing an organized view of complex relationship data.
⦿ User-Friendly Interface: Design an interface that facilitates effortless data analysis, enabling researchers to explore relationships without being burdened by the complexity of raw survey data.
⦿ Comparative Analysis: Implement tools for comparative analysis, allowing researchers to uncover nuanced insights by comparing variables such as age, gender, education, and relationship history.
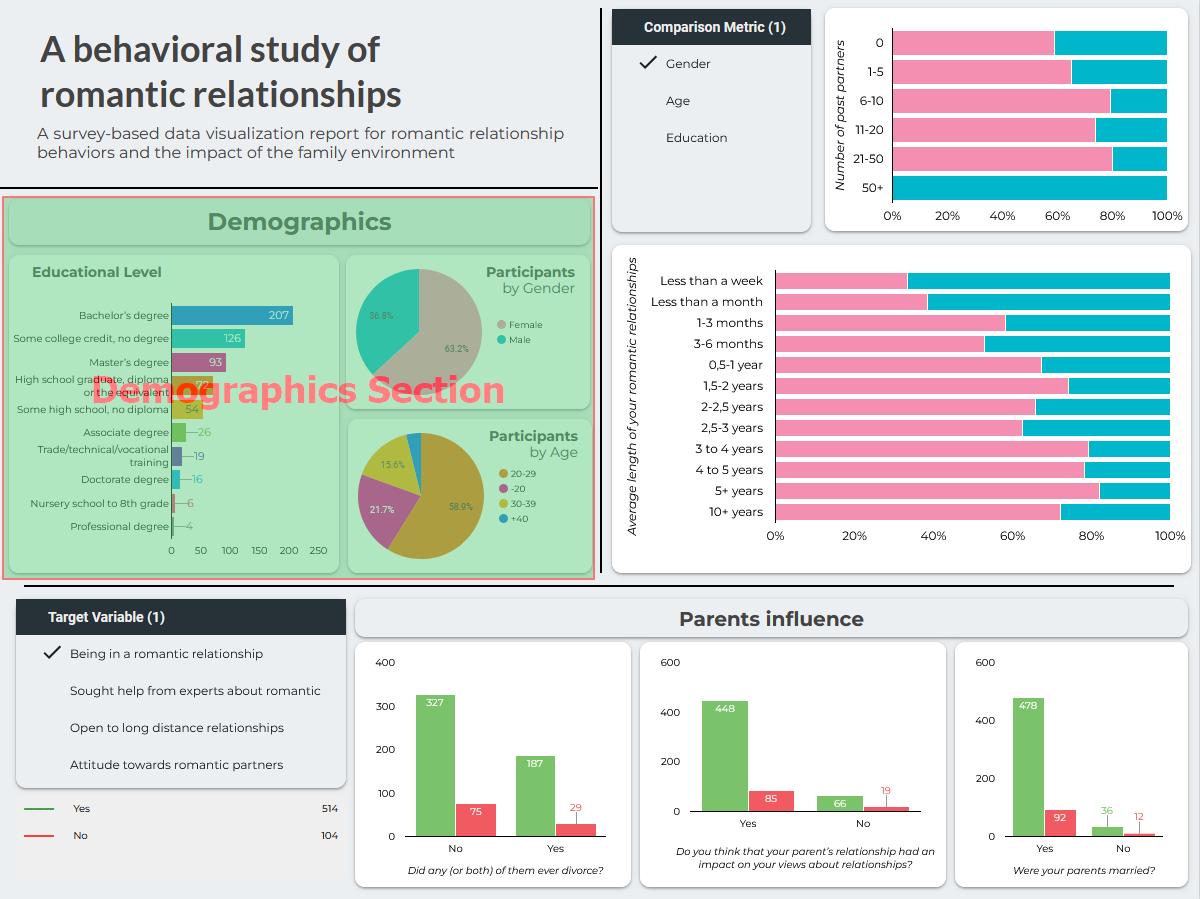
The section was created to navigate the landscape of participant characteristics, offering a comprehensive view of the survey's diverse participant base, and enabling for cross filtering using these characteristics.
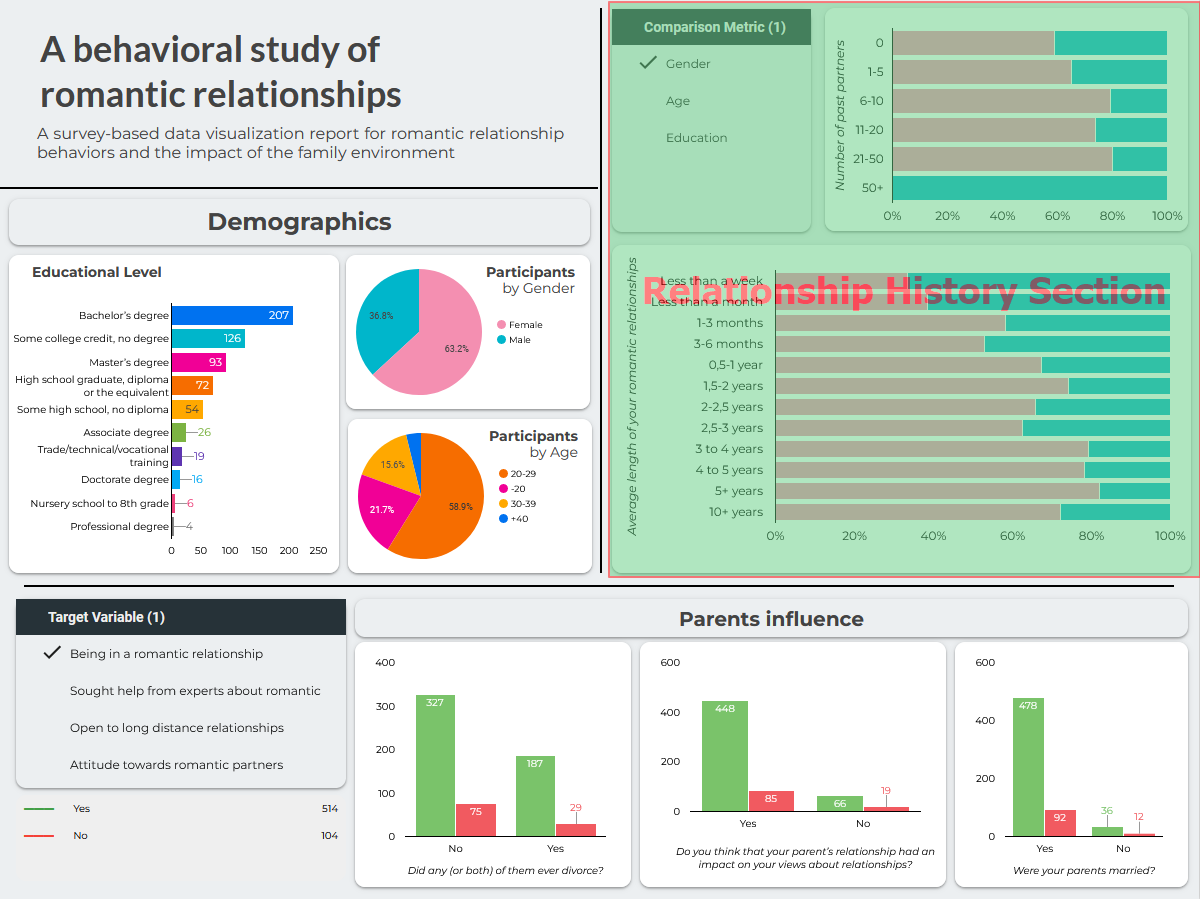
We can delve into the nuances of relationship histories with the Relationship History Section, providing detailed insights into the number of past partners and the average length of participants' romantic relationships.
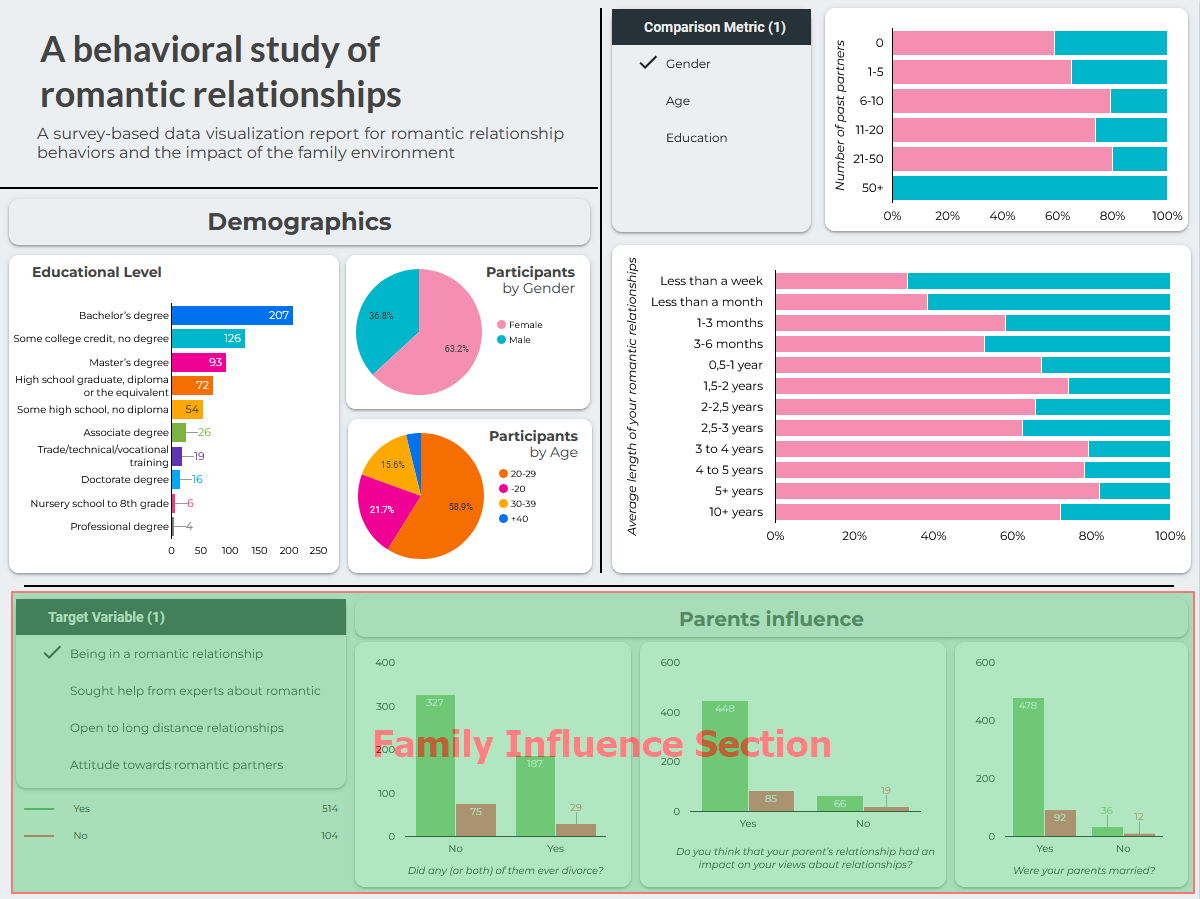
We can examine the profound impact of family environments on romantic relationships through the Family Influence Section, featuring side-by-side bar charts that compare the frequencies of key features.
✔️ Survey results presented in a clear and user-friendly format, saving researchers valuable time.
✔️ A centralized space for survey results, providing easy access and navigation.
✔️ Apply filters and select parameters to dynamically change charts, enabling a multitude of research avenues without extensive data manipulation.
✔️ Tools for comparing variables like age, gender, and education, uncovering nuanced relationships within the data.
✔️ Leverage the dashboard's flexibility for additional research papers or explore related topics, ensuring the study's data continues to provide valuable insights.
✔️ A resourceful tool for delving deeper into the complexities of romantic relationships, offering enduring value for ongoing and future research.
✔️ Ability to compare variables allows for the identification of nuanced patterns and relationships within the data.
✔️ Dive deep into relationship nuances, such as the impact of family environments on romantic relationships.
Use the dashboard to get instant insights, apply filters and select different date ranges
Understanding the dynamics between partners in a romantic relationship and the influence of family environments is a complex but profoundly important pursuit. The below dashboard for a “Behavioral Study of Romantic Relationships” was designed to serve as a comprehensive repository for the results of a survey-based research study. It not only simplifies the presentation of survey findings but also equips researchers with a powerful tool to explore and analyze data in-depth, aiding the creation of future research papers with ease.
The motivation behind creating this dashboard was to provide a centralized space for survey results, enabling researchers to effortlessly access and analyze data related to romantic relationship behaviors and the impact of family environments. With three distinct sections, it’s a versatile tool for comprehensive research:
Demographics Section:
Relationship History Section:
Family Influence Section:
Effortless Data Access: All survey results are presented in a user-friendly format, simplifying the presentation of findings and saving researchers valuable time.
Flexible Data Analysis: Researchers can effortlessly apply filters and select parameters to dynamically change the charts in the dashboard, thereby enabling a multitude of research avenues without the need for extensive data manipulation.
Deeper Insights: With the ability to compare variables like age, gender, and education, researchers can uncover nuanced relationships within the data.
Family Impact Assessment: Understanding the influence of family environments on romantic relationships is made easy with the side-by-side comparisons.
Resourceful for Future Research: Researchers can leverage the dashboard’s flexibility to generate additional research papers or explore related topics, ensuring the study’s data continues to provide valuable insights.
Navigating the intricate world of romantic relationships and family dynamics has never been more accessible. Our “Behavioral Study of Romantic Relationships” dashboard simplifies complex data, enabling data-driven decisions and in-depth analysis, ultimately advancing the understanding of the human heart.
Discover the versatility of our looker studio dashboards services, by exploring the following real-life examples showcasing how similar dashboards can be developed for various research studies, providing valuable insights and simplifying data analysis.
❌ Problem: Understanding factors influencing employee engagement.
✔️ Solution: Develop a dashboard with sections for demographics, work history, and influence factors, enabling comparative analysis to identify patterns.
❌ Problem: Assessing the effectiveness of educational programs.
✔️ Solution: Create a dashboard with student demographics, academic performance, and program satisfaction sections, enabling educators to make informed decisions.
❌ Problem: Analyzing the environmental impact of human activities.
✔️ Solution: Design a dashboard featuring sections for demographic information, activity history, and environmental practices, simplifying data access for environmental researchers.
❌ Problem: Gathering feedback on new product development.
✔️ Solution: Develop a dashboard with customer demographics, product preferences, and feedback sections, facilitating quick insights for product development teams.
❌ Problem: Studying the financial behavior of specific demographics.
✔️ Solution: Craft a dashboard featuring sections for financial habits, income levels, and investment preferences, offering valuable insights for financial analysts.
❌ Problem: Investigating customer satisfaction levels.
✔️ Solution: Craft a dashboard featuring sections for customer demographics, purchase history, and satisfaction factors, facilitating easy access and comparison.
❌ Problem: Studying the impact of lifestyle on health and wellness.
✔️ Solution: Develop a dashboard with sections for participant demographics, health habits, and wellness indicators, providing a holistic view for researchers.
❌ Problem: Gauging public opinion on political matters.
✔️ Solution: Craft a dashboard with sections for voter demographics, political affiliation, and opinion trends, offering a comprehensive view for political analysts.
❌ Problem: Understanding patterns in social media usage.
✔️ Solution: Create a dashboard with user demographics, interaction history, and content preferences sections, aiding social media researchers in data exploration.
❌ Problem: Evaluating the effectiveness of diversity and inclusion initiatives.
✔️ Solution: Develop a dashboard with employee demographics, workplace experiences, and diversity perceptions sections, empowering organizations to foster inclusive environments.