

In the dynamic landscape of human resources, understanding and managing key metrics are essential for fostering a productive and satisfied workforce. Examine our HR Management Report powered by Power BI, designed to provide a comprehensive view of critical KPIs, attrition patterns, and employee satisfaction, all aimed at enhancing HR decision-making and organizational well-being.
⦿ Attrition Challenges: Identifying and addressing attrition patterns, understanding the factors contributing to employee turnover.
⦿ Satisfaction Insights: Gaining insights into employee satisfaction across different job roles to enhance workplace engagement.
⦿ Demographic Understanding: Analyzing age and gender distribution to tailor HR strategies for diverse employee segments.
⦿ Attrition Management: Develop strategies to reduce attrition by understanding its correlation with education levels, departments, and other key factors.
⦿ Enhancing Satisfaction: Improve overall employee satisfaction by identifying areas of improvement within specific job roles.
⦿ Demographic Strategy: Tailor HR policies and initiatives based on a nuanced understanding of employee demographics to foster inclusivity and support.
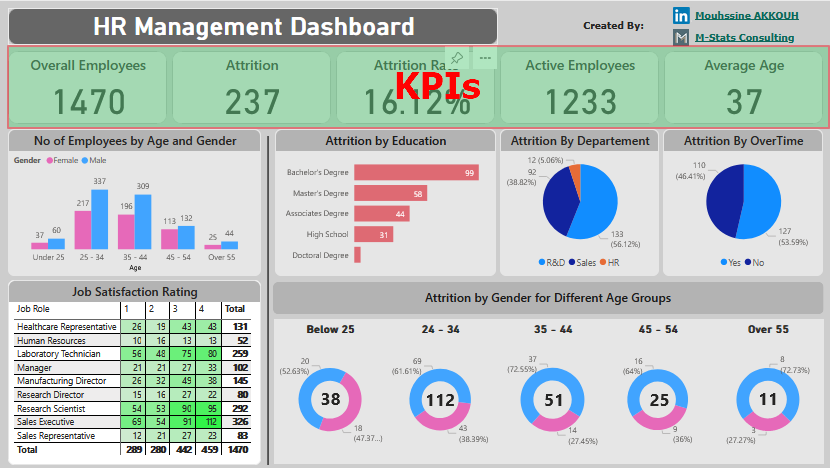
Track the organization's workforce health through fundamental KPIs.
Visualize the age and gender distribution of employees, along with their attrition patterns.


Evaluate employee satisfaction within distinct job roles.
Explore factors contributing to attrition.

✔️ Efficient Decision-Making: Centralized view of key HR metrics allows quick access to critical information.
✔️ Time Saving: Minimizes the need for extensive data extraction and analysis, saving valuable time for HR professionals.
✔️ Identifying Patterns on attrition by education, department, and overtime enable targeted strategies for employee retention.
✔️ Proactive Decision-Making: Early identification of attrition trends allows for proactive measures to enhance employee satisfaction.
✔️ Demographic Insights: Clarity on age and gender distribution fosters a better understanding of workforce diversity.
✔️ Inclusive Policies: Facilitates the formulation of inclusive HR policies, considering the unique needs of diverse employee segments.
✔️ Tailored Approaches: Job role satisfaction matrix provides tailored insights for improving workplace satisfaction.
✔️ Strategic Interventions: Helps HR professionals identify specific areas for improvement, leading to strategic interventions.
Explore how our HR Management & Analysis Dashboard can address critical HR challenges in various organizations, providing tailored solutions for workforce optimization.
❌ Problem: High attrition rates within the IT department impacting project continuity and team morale.
✔️ Solution: Analyzed attrition patterns, identified job roles prone to turnover, and implemented targeted retention strategies.
❌ Problem: Concerns about excessive overtime affecting employee satisfaction and well-being.
✔️ Solution: Examined attrition data based on overtime, leading to the revision of overtime policies for better work-life balance.
❌ Problem: One-size-fits-all training programs not resonating with employees of different age groups.
✔️ Solution: Utilized age-group-specific attrition data to tailor training programs, ensuring relevance and effectiveness.
❌ Problem: Discrepancies between HR policies and employee expectations leading to dissatisfaction.
✔️ Solution: Conducted satisfaction matrix analysis to align policies with employee expectations, enhancing overall satisfaction.
❌ Problem: High attrition rates among specific age groups affecting team stability.
✔️ Solution: Examined age-group-specific attrition trends and implemented targeted retention initiatives.
❌ Problem: Lack of diversity awareness and understanding of workforce demographics.
✔️ Solution: Utilized age and gender distribution insights to formulate inclusive HR policies and promote diversity.
❌ Problem: Decreased job satisfaction among customer service representatives impacting service quality.
✔️ Solution: Leveraged job role satisfaction matrix to identify pain points and implemented targeted improvements.
❌ Problem: Lack of clarity on high-performing and under-performing departments.
✔️ Solution: Utilized state-wise observations to identify top and bottom-performing regions, optimizing resource allocation.
❌ Problem: Uncertainty in workforce planning for expansion and growth.
✔️ Solution: Utilized historical data and monthly time-series charts for informed workforce planning and resource allocation.
❌ Problem: Shifts in employee expectations and work preferences post-pandemic.
✔️ Solution: Leveraged real-time monitoring to adapt HR strategies, ensuring alignment with evolving workforce needs.