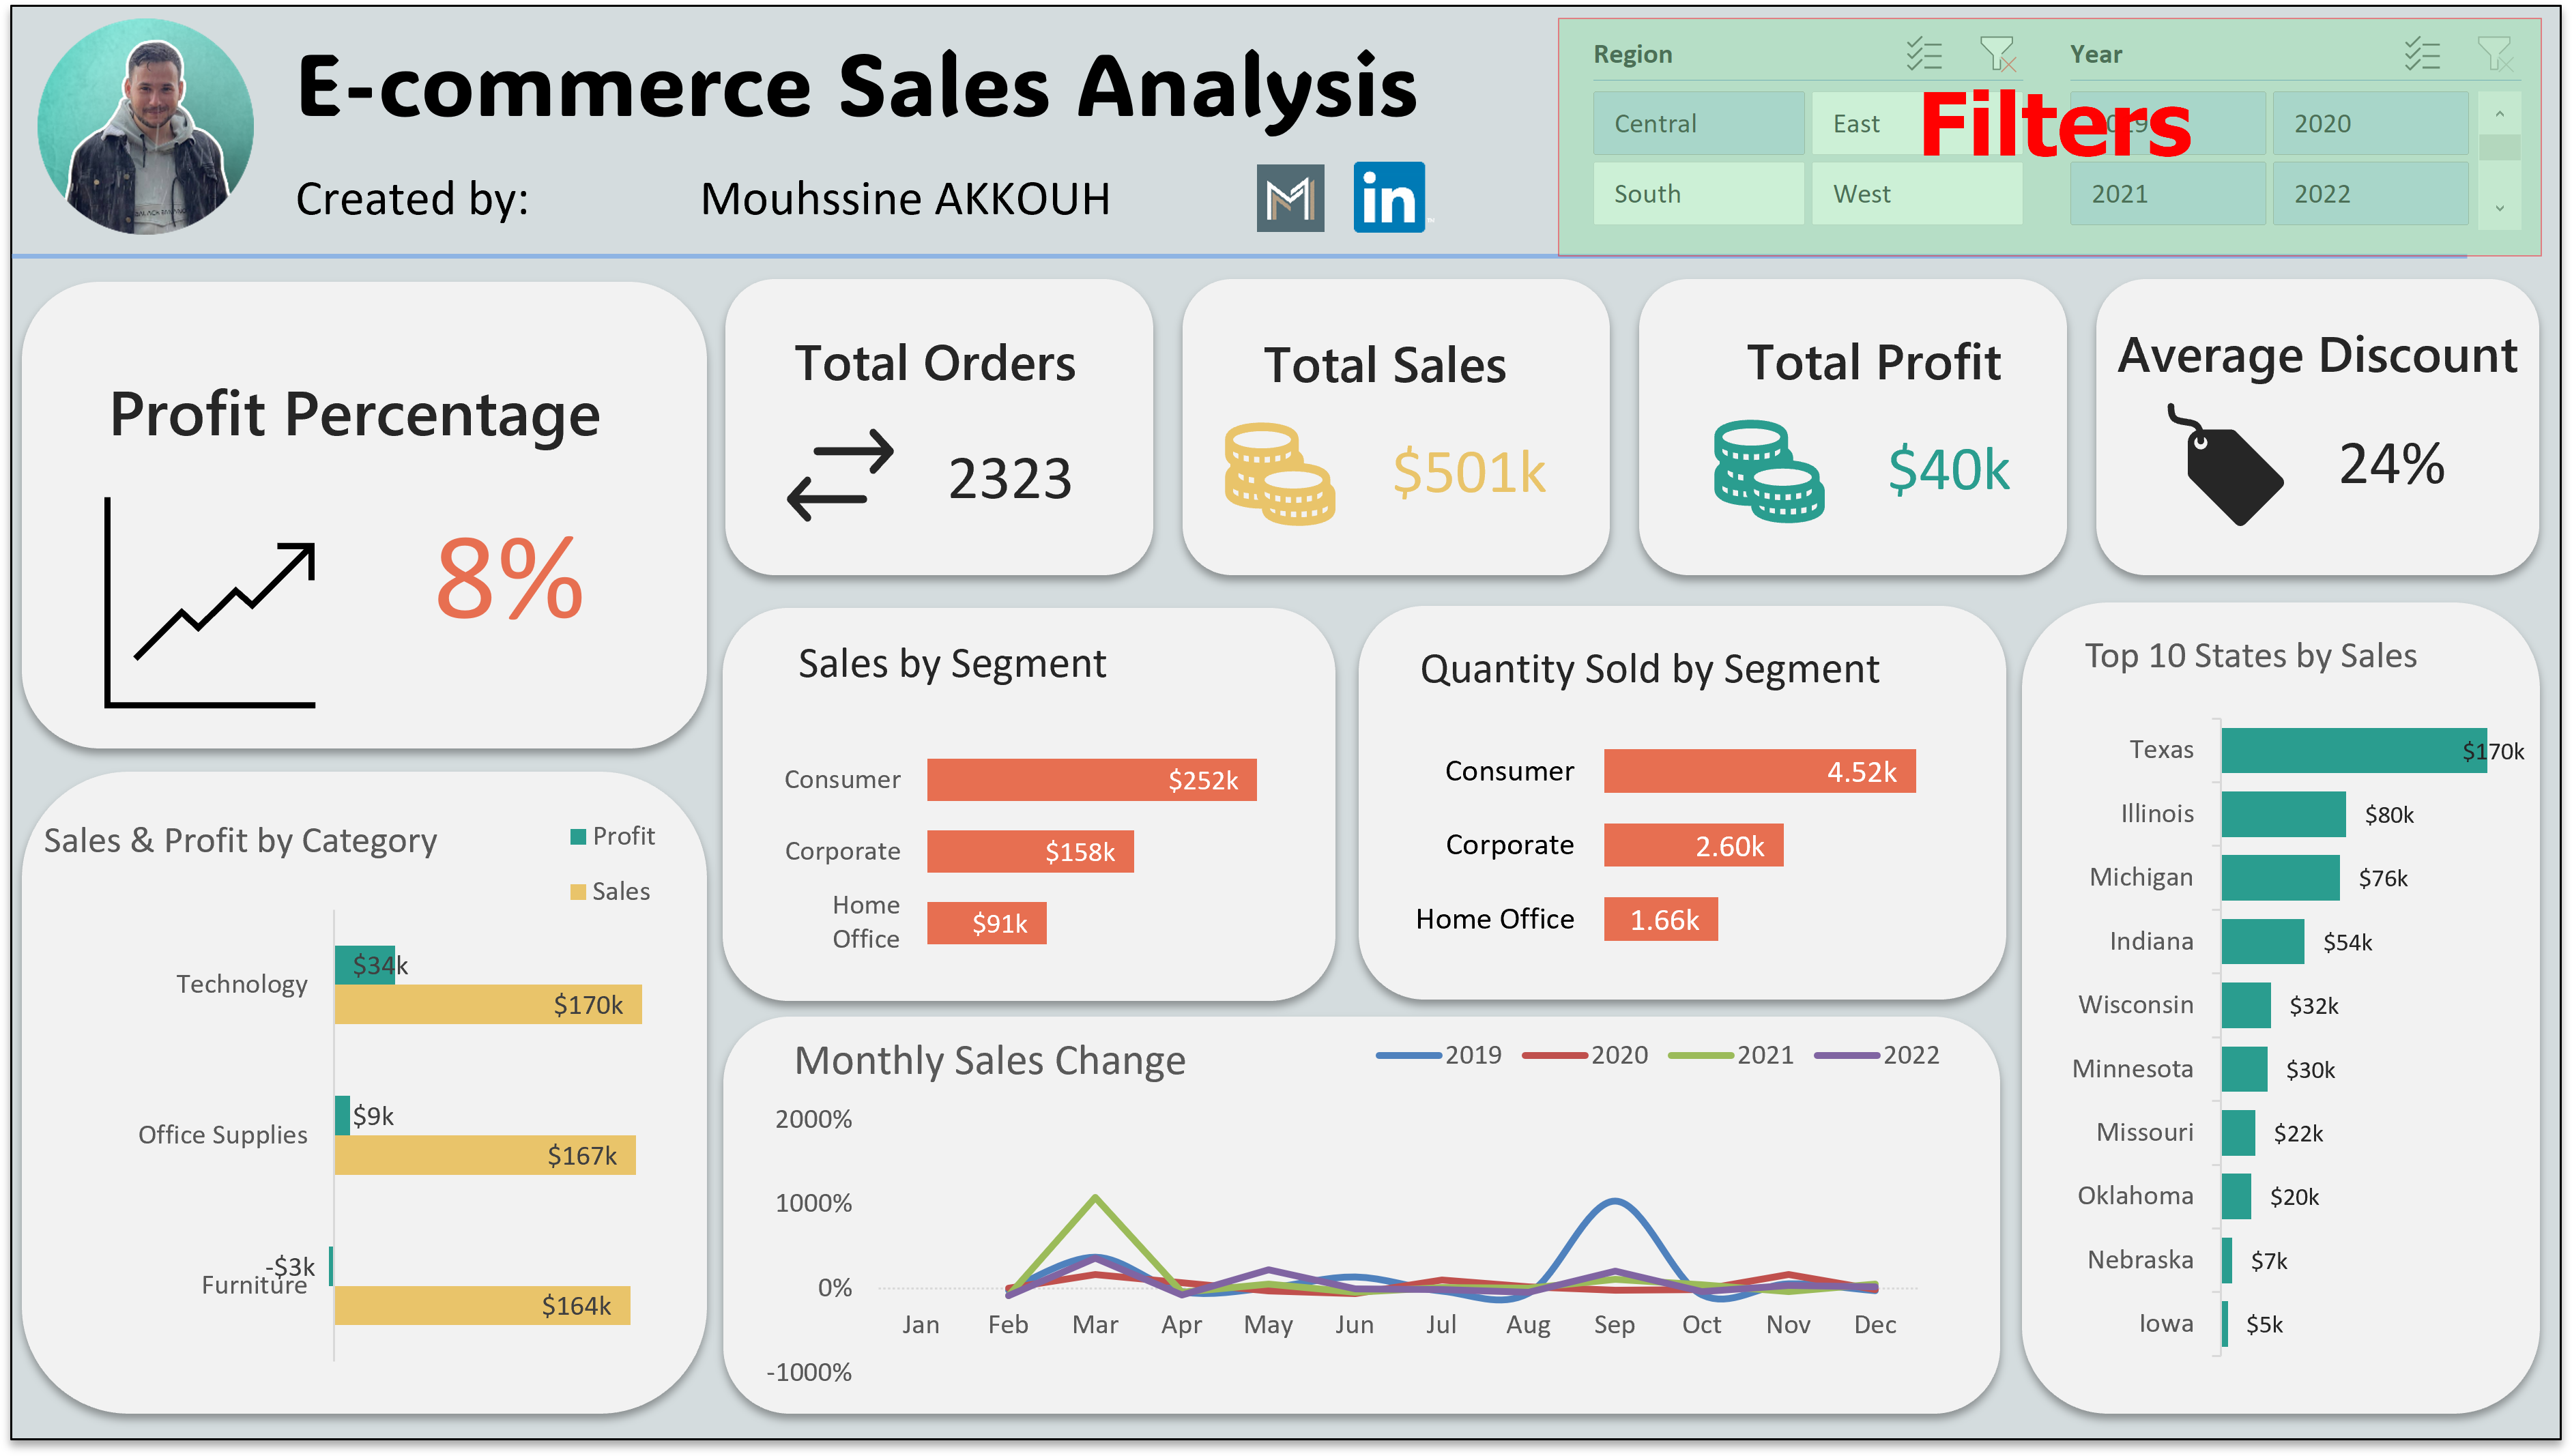

1. Filters for Precision
Year Filter: Customize your analysis by selecting the specific year(s) of interest.
Regional Filter: Drill down into regional sales data by choosing a specific region(s) within the U.S.
In the dynamic landscape of e-commerce, understanding sales performance is key to strategic decision-making and business growth. Dive into our Excel Sales Analysis Dashboard, meticulously crafted to empower you with insights into the nuances of sales, profit, and customer behavior. Uncover trends, optimize strategies, and elevate the e-commerce capabilities.
⦿ Regional Disparities: Identifying and addressing variations in sales performance across different regions in the U.S.
⦿ Profitability Metrics: Gaining clarity on profit percentages and understanding the factors influencing profitability.
⦿ Segmented Insights: Uncovering patterns in sales and quantity sold by segments to optimize marketing and product strategies.
⦿ Regional Optimization: Enhance sales strategies by addressing disparities and capitalizing on regional strengths.
⦿ Profitability Enhancement: Improve profit margins by identifying areas for cost optimization and strategic pricing.
⦿ Segmented Strategy: Tailor marketing and product offerings based on insights from segmented sales and quantity data.


Year Filter: Customize your analysis by selecting the specific year(s) of interest.
Regional Filter: Drill down into regional sales data by choosing a specific region(s) within the U.S.


Sales by Segment: Analyze sales performance in distinct market segments.
Quantity Sold by Segment: Understand product popularity through segment-specific quantity data.


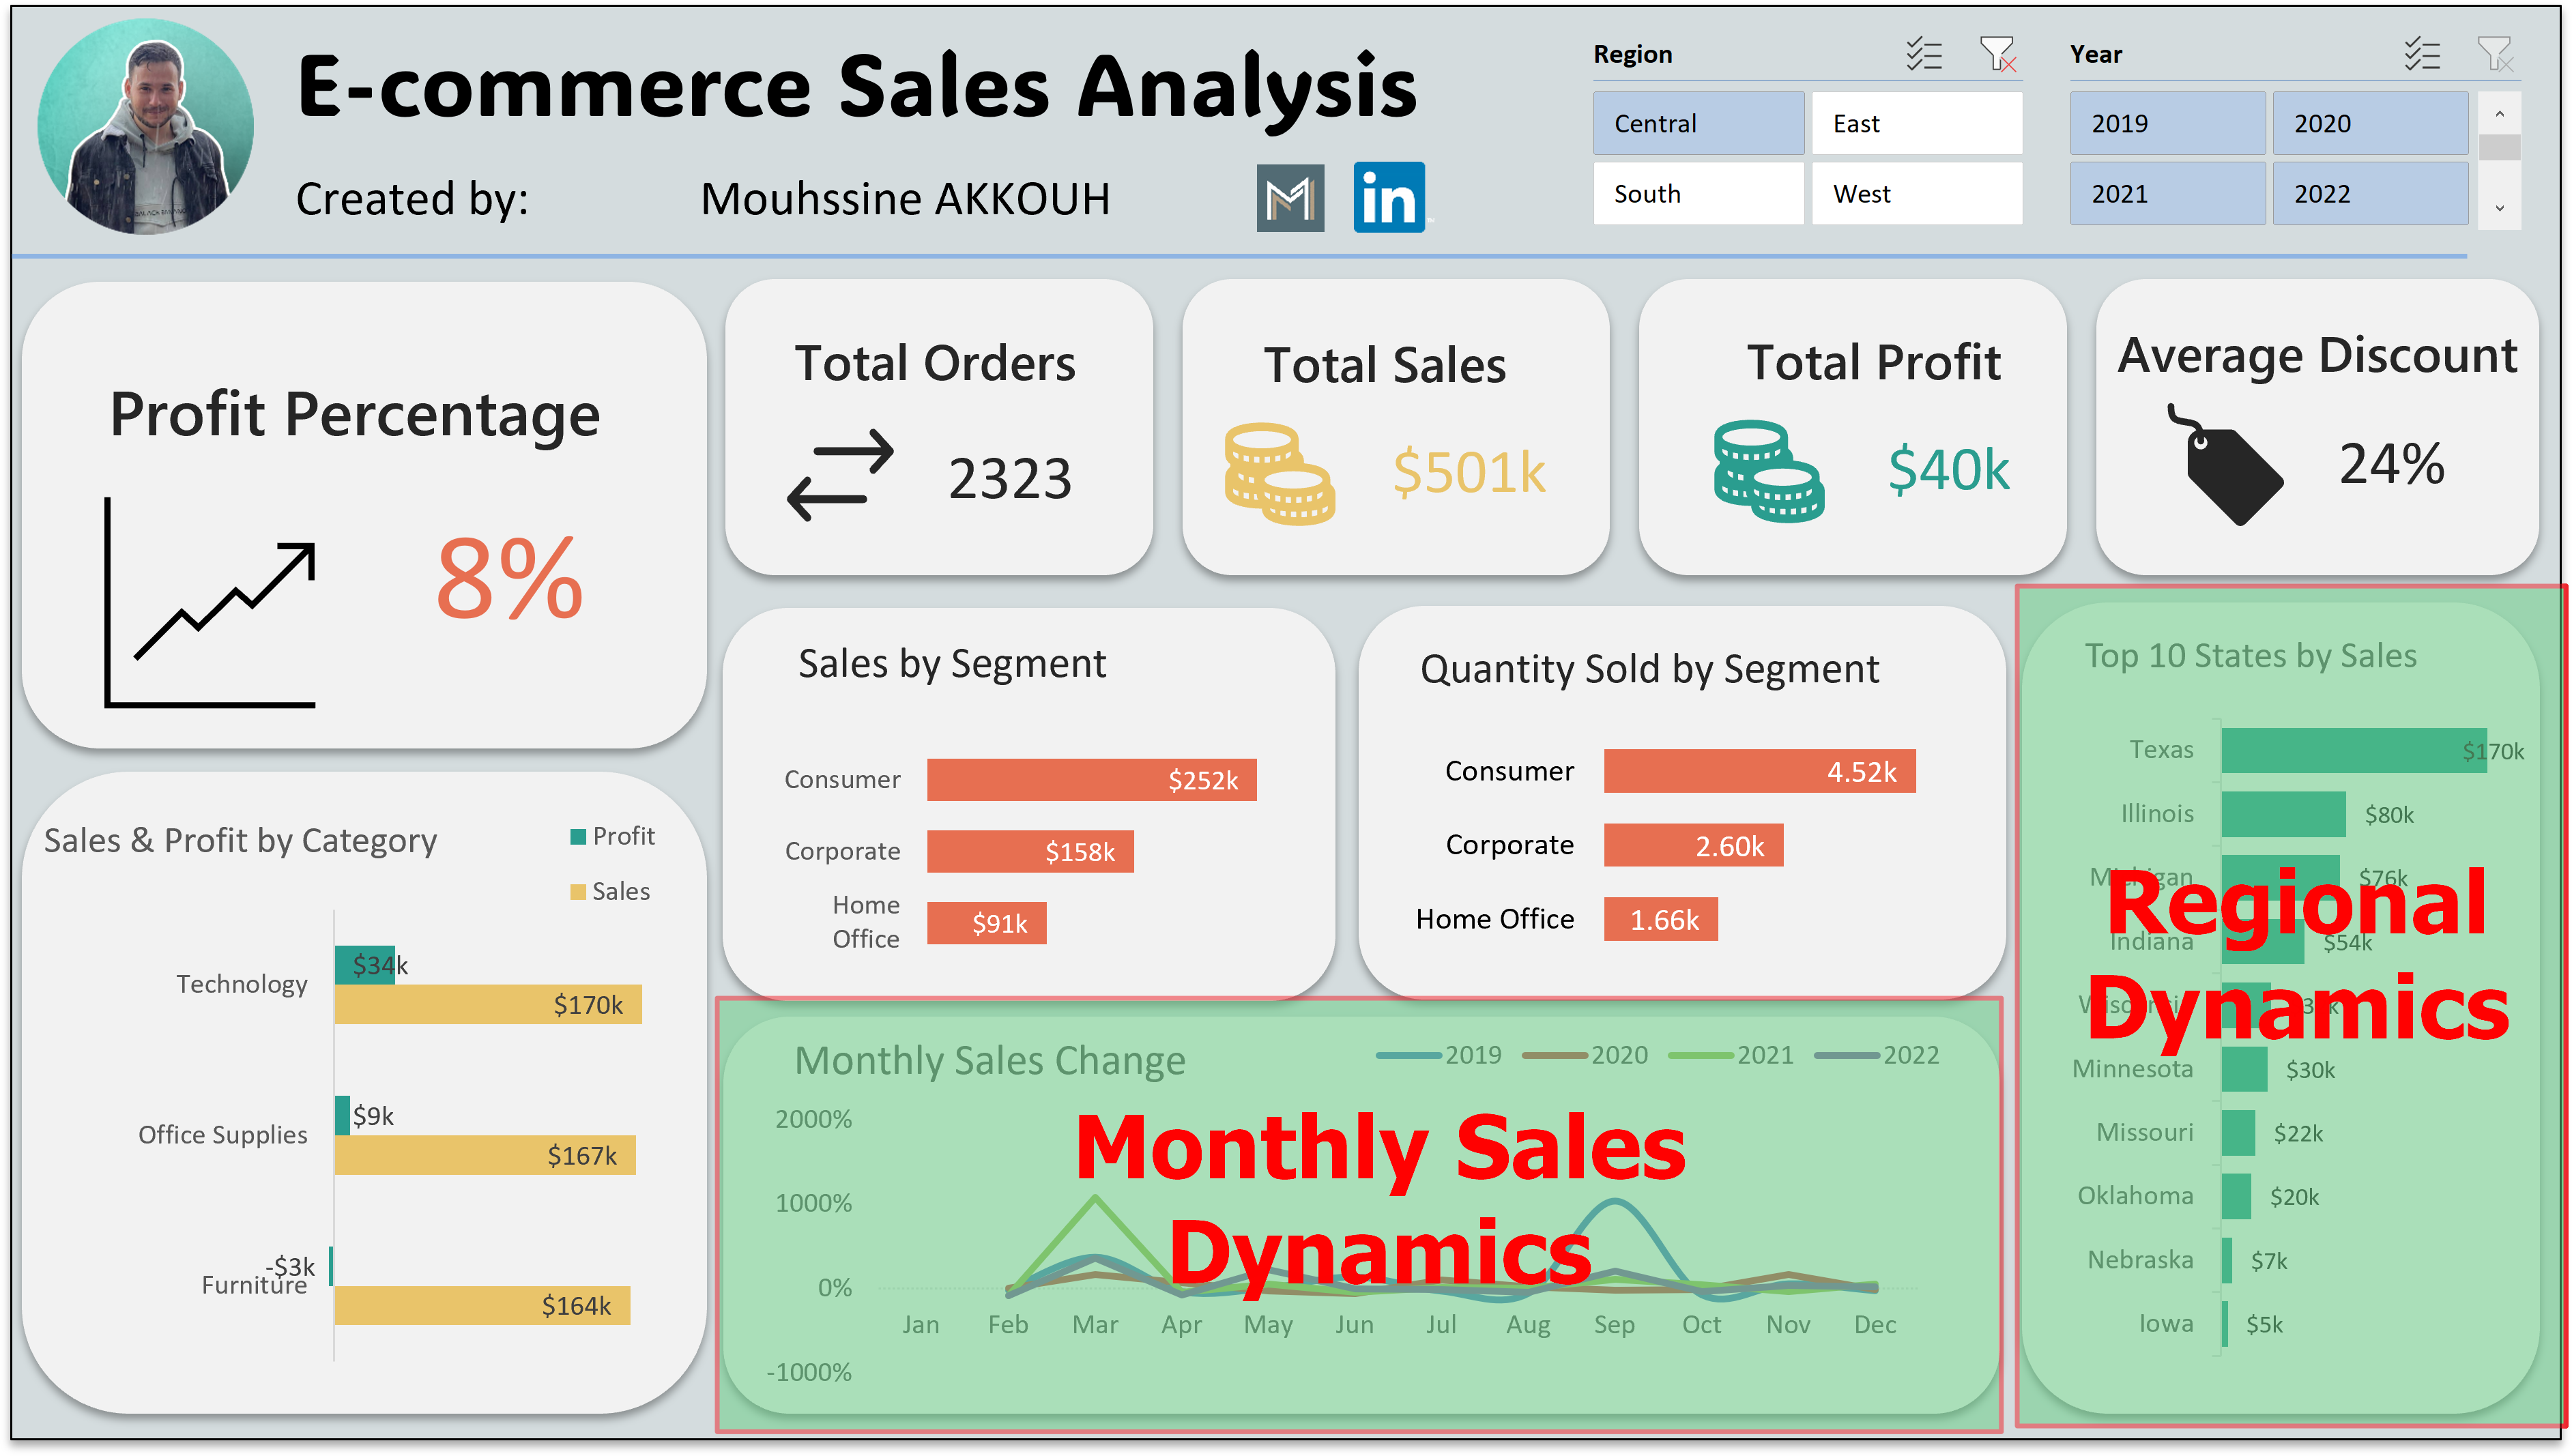
Top 10 Sales by State: Identify top-performing states in terms of sales volume.
Monthly Sales Change: Track the monthly sales change over the selected years.
Uncover the essence of our Excel Sales Analysis Dashboard and why it stands out as an indispensable tool for businesses navigating the dynamic e-commerce landscape.
✔️ Precision Insights: Make informed decisions with detailed insights into sales, profit margins, and customer behavior.
✔️ Strategic Planning: Craft strategies backed by data to enhance profitability and optimize resource allocation.
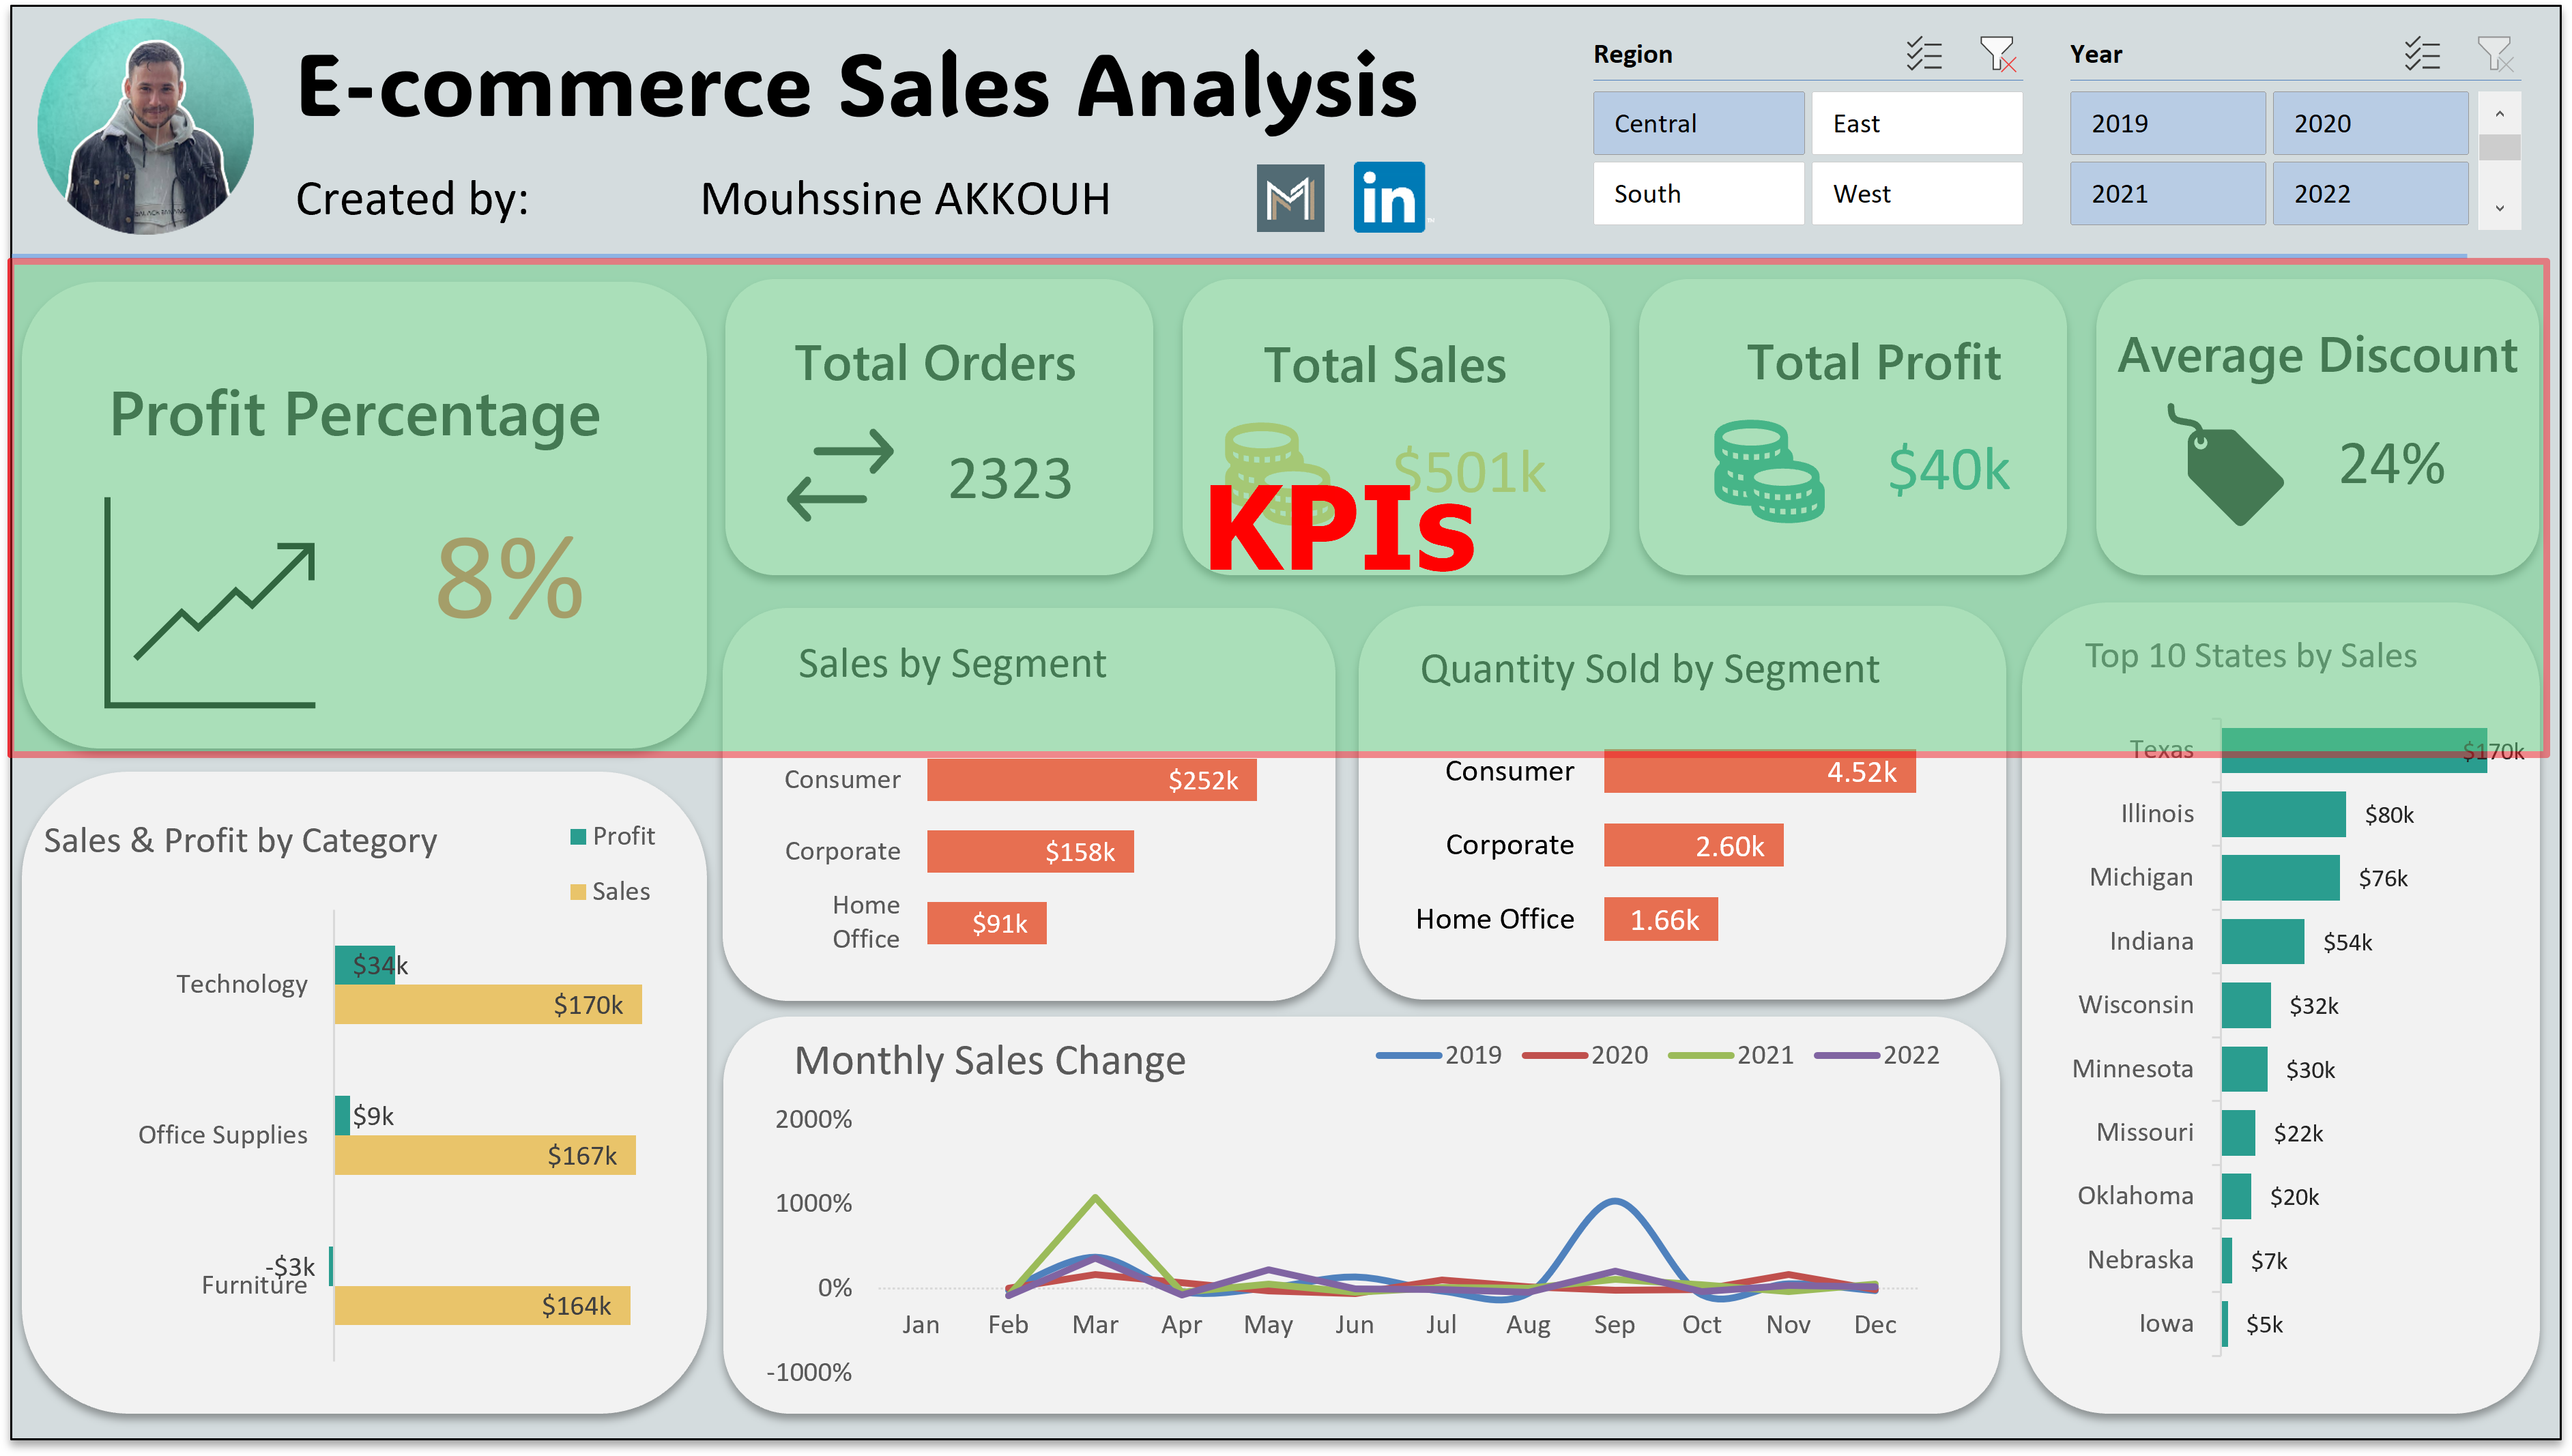
✔️ Holistic Performance Metrics: Evaluate overall performance with a glance at crucial KPIs, from profit percentage to total sales.
✔️ Segment-specific Analytics: Pinpoint the performance of specific segments to tailor strategies for diverse markets.
✔️ Yearly Adaptations: Adapt your approach annually with a deep dive into year-wise sales dynamics.
✔️ Regional Optimization: Fine-tune strategies based on regional nuances and customer behaviors.
Explore how our Sales Analysis Dashboard can be a game-changer for businesses across diverse scenarios, facilitating data-driven decisions and driving success.
❌ Problem: A company faced challenges expanding its product lines, unsure of which products were performing well.
✔️ Solution: Leveraging the Sales Analysis Dashboard, they identified top-performing products, guiding decisions on product expansion and marketing strategies.
❌ Problem: An e-commerce store wanted to tailor marketing strategies for different customer segments but lacked insights.
✔️ Solution: The dashboard's segment-specific analytics guided personalized marketing approaches, enhancing engagement and conversion rates.
❌ Problem: An online retailer struggled to optimize discount strategies, leading to unclear impacts on overall sales and profits.
✔️ Solution: The dashboard's average discount KPI provided insights, helping the business refine discount structures for better outcomes.
❌ Problem: A business sought to maximize the impact of marketing campaigns but lacked insights into segment-specific preferences.
✔️ Solution: Segment-specific analytics enabled the creation of targeted marketing campaigns, boosting customer engagement.
❌ Problem: A company faced challenges predicting and adapting to seasonal sales patterns.
✔️ Solution: Time-series analysis in the dashboard allowed them to identify and prepare for seasonal variations in advance.
❌ Problem: A business struggled to penetrate specific regional markets effectively, leading to sub-optimal sales in those areas.
✔️ Solution: Using regional sales insights, they devised targeted marketing campaigns, resulting in increased market share in previously under-performing regions.
❌ Problem: A company needed a systematic approach for yearly performance reviews, lacking a consolidated overview.
✔️ Solution: By utilizing yearly performance data, they streamlined performance reviews, identifying growth areas and setting achievable targets.
❌ Problem: A company wished to enhance certain product categories but lacked clarity on customer preferences.
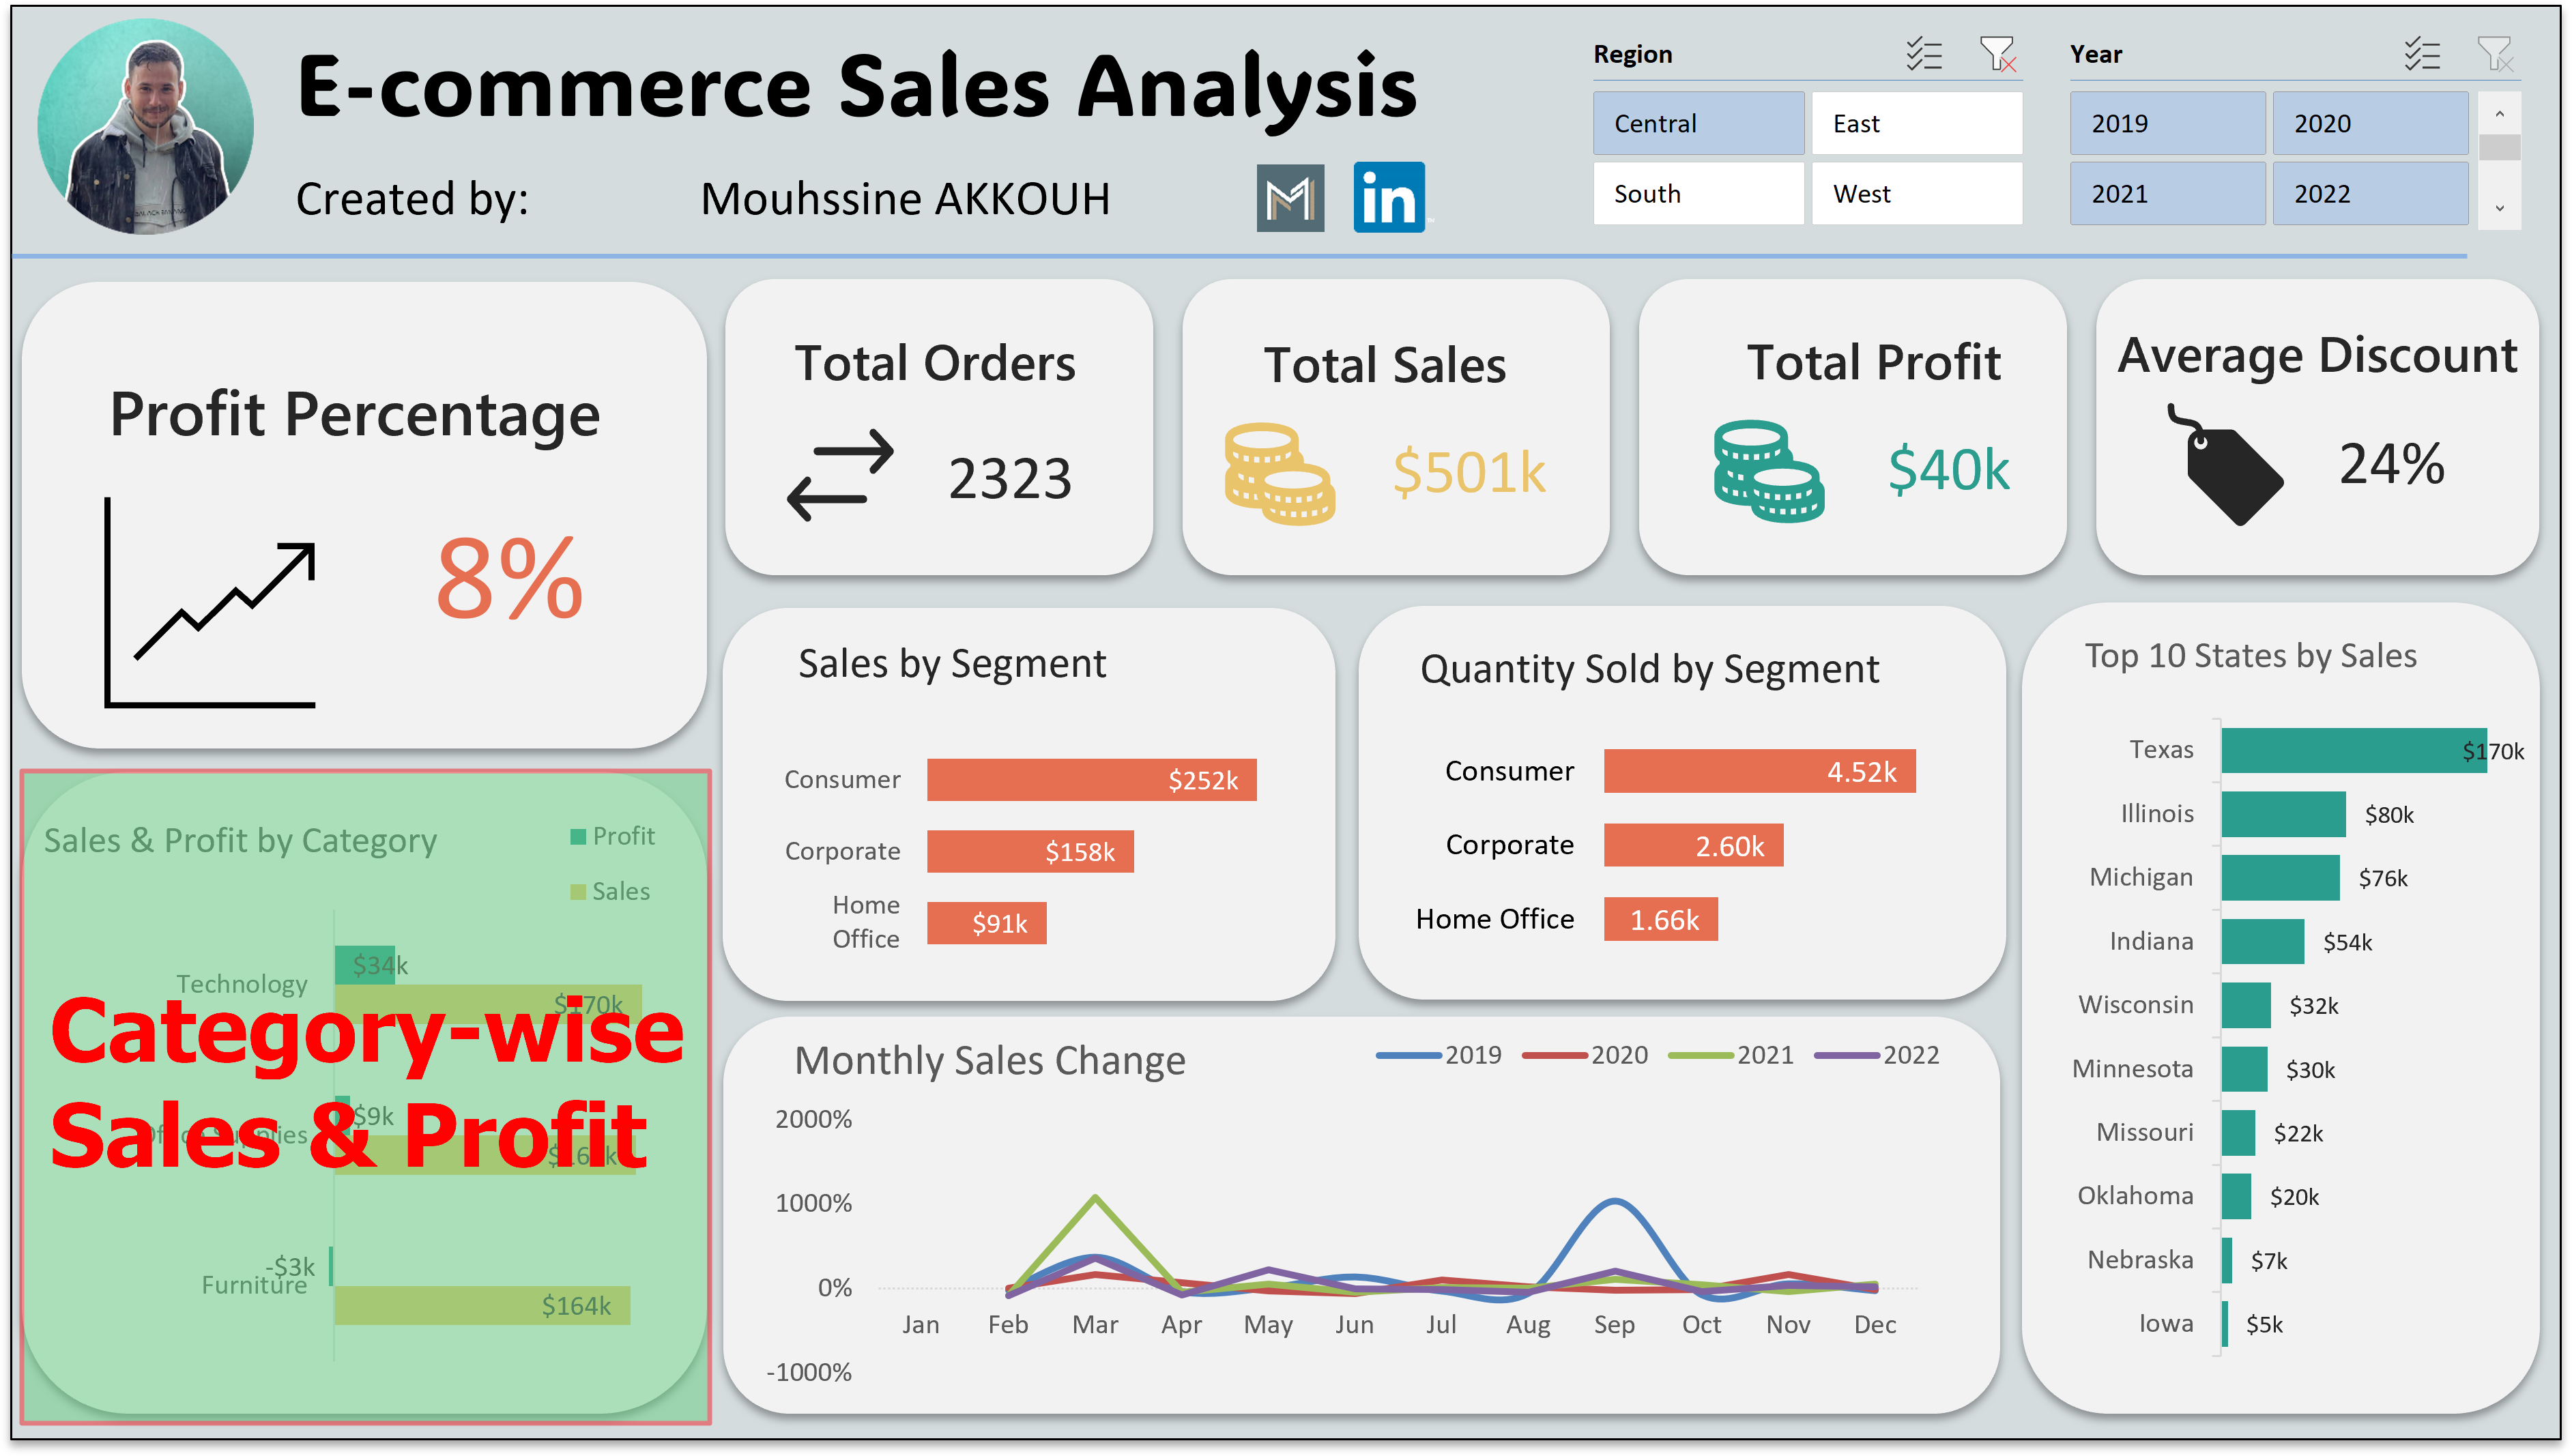
✔️ Solution: Sales by category insights guided them in focusing on high-demand product categories, optimizing inventory and marketing efforts.
❌ Problem: A retailer struggled to adapt to changing regional trends, resulting in stock imbalances.
✔️ Solution: Regional sales insights facilitated swift adjustments to inventory, aligning with regional preferences and trends.
❌ Problem: A business wanted to benchmark its performance against competitors but lacked accessible comparative data.
✔️ Solution: The dashboard enabled them to compare their sales data with industry benchmarks, informing competitive strategies.