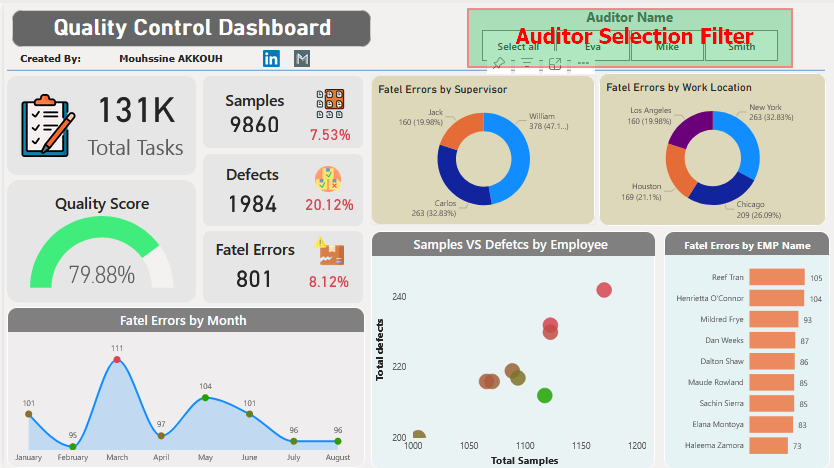


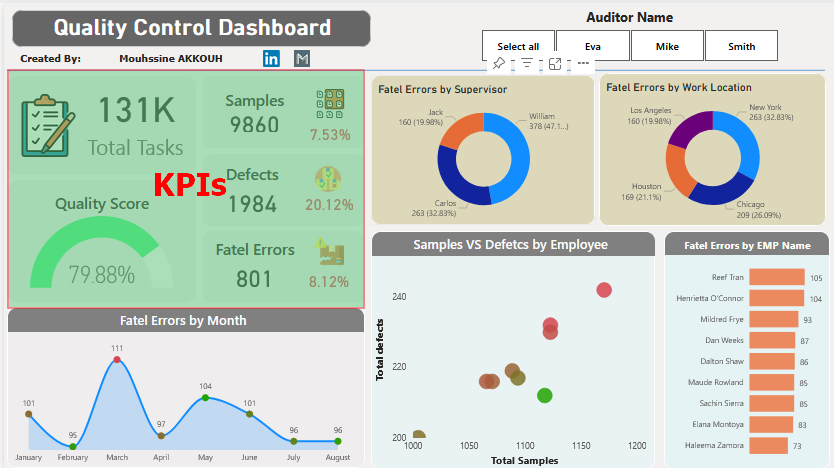
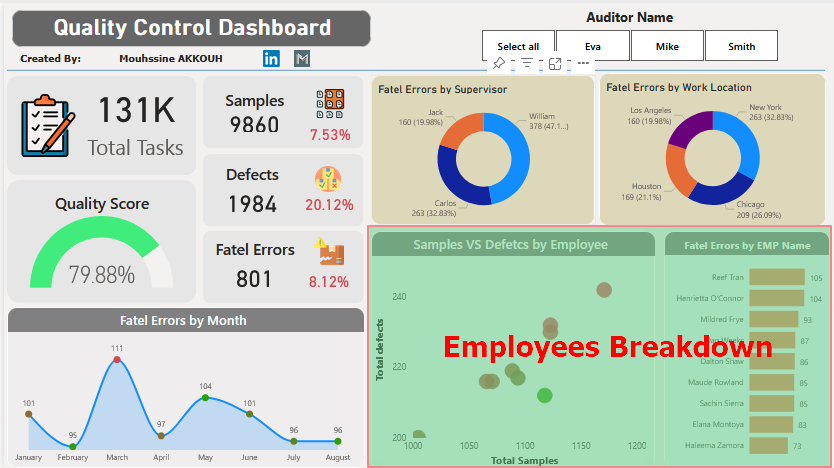
In manufacturing, ensuring the highest quality standards is paramount. Our Quality Control Dashboard, crafted with Power BI, provides a comprehensive view of key performance indicators (KPIs) and crucial metrics to empower auditors and decision-makers in maintaining and improving product quality.
Explore how this dashboard enhances quality control in the factory, offering real-time visibility into tasks, samples, defects, fatal errors, and overall quality scores.
⦿ Manual and Time-Consuming Processes: Traditional quality control processes relying on manual documentation and analysis, leading to inefficiencies and delays.
⦿ Lack of Real-time Visibility: Absence of a centralized system for real-time monitoring of quality metrics, hindering quick decision-making and preventive actions.
⦿ Inconsistent Quality Across Auditors: Varied approaches and criteria among auditors, contributing to inconsistencies in quality control outcomes
⦿ Automated Data Capture: Implement a system that automates the capture of quality-related data, reducing manual efforts and enhancing accuracy.
⦿ Real-time Monitoring and Reporting: Develop a dashboard that provides real-time visibility into quality metrics, enabling timely responses and interventions.
⦿ Standardized Quality Criteria: Establish standardized criteria and benchmarks for quality control tasks to ensure consistency across auditors.
Check the significance of our Quality Control Dashboard, a transformative tool that goes beyond conventional metrics, providing unparalleled value to your quality control processes.
✔️ Immediate access to real-time data ensures swift decision-making and proactive intervention.
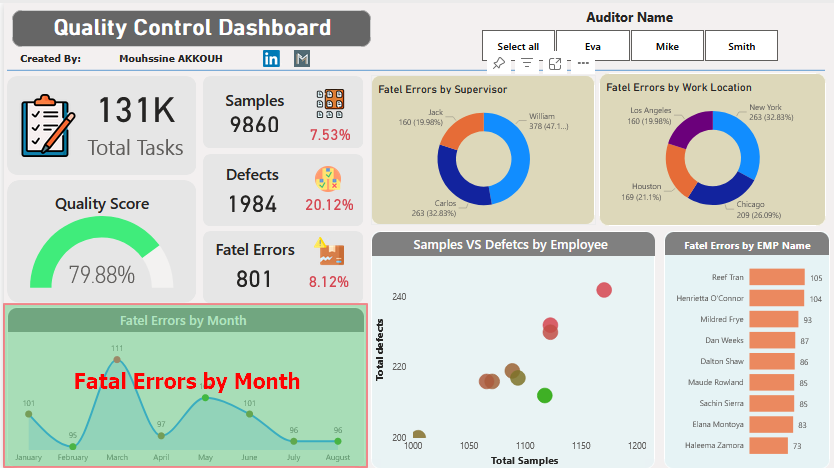
✔️ Enables timely responses to emerging trends, minimizing the impact of potential issues.
✔️ Identifies top-performing and under-performing areas, allowing for focused improvement efforts.
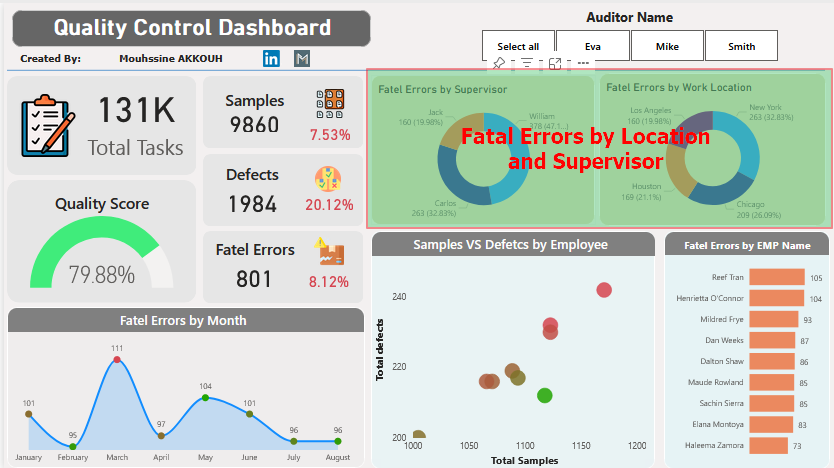
✔️ Provides insights into fatal errors by location, supervisor, and employee for strategic planning.
✔️ Establishes standardized criteria for quality control tasks, ensuring consistency across auditors.
✔️ Facilitates benchmarking against established criteria, promoting continuous improvement.
✔️ Allows for targeted interventions in regions with high fatal error rates, enhancing manufacturing precision.
✔️ Fosters improvements in the quality score percentage over time.
Explore the versatility of our Quality Control Dashboard through real-life scenarios where it becomes an indispensable asset, revolutionizing quality management across various industries.
❌ Problem: Managing quality across complex manufacturing processes in the automotive sector.
✔️ Solution: The dashboard streamlined defect analysis, leading to targeted improvements and reduced production errors.
❌ Problem: Meeting stringent quality standards and regulatory compliance in pharmaceutical manufacturing.
✔️ Solution: The dashboard provided real-time visibility into quality metrics, ensuring adherence to regulatory requirements.
❌ Problem: Establishing consistent quality benchmarks for consumer goods manufacturing.
✔️ Solution: The dashboard facilitated benchmarking against standardized criteria, promoting a culture of continuous improvement.
❌ Problem: Ensuring safety measures in critical energy infrastructure projects.
✔️ Solution: The dashboard provided insights into fatal errors, contributing to enhanced safety protocols.
❌ Problem: Efficiently allocating resources for quality control tasks in electronic component production.
✔️ Solution: The dashboard's correlation insights empowered auditors to optimize resource allocation, improving efficiency.
❌ Problem: Identifying and mitigating contamination risks in food processing.
✔️ Solution: Through location-specific fatal error insights, the dashboard facilitated targeted interventions, minimizing contamination risks.
❌ Problem: Managing quality disparities in textile production across different regions.
✔️ Solution: The dashboard's regional breakdown of fatal errors enabled targeted quality improvement initiatives.
❌ Problem: Streamlining quality inspections in the logistics and supply chain.
✔️ Solution: The dashboard's efficiency in resource allocation enhanced the speed and accuracy of quality inspections.