Navigate the E-commerce Store Sales using a Looker Studio Dashboard

Crafted to address losses in specific cities, this dynamic tool propels the business into a realm of comprehensive sales insights. Uncover profit sources, strategically optimize, and let data-driven decisions chart the path to e-commerce excellence.

Business Understanding

Problems

⦿ City-Specific Losses: The online store experienced significant losses in specific cities, indicating a need for a targeted analysis to identify root causes.

⦿ Profit and Loss Gaps: The existing sales pipeline lacked a comprehensive overview, making it challenging to pinpoint sources of profit and loss accurately.

Objectives

⦿ Thorough Sales Audit: Conduct a meticulous audit of the sales pipeline to understand and rectify the factors contributing to city-specific losses.

⦿ Comprehensive Overview: Develop a dashboard that offers a comprehensive view of every variable in the sales process, enabling precise identification of sources of profit and loss.

Dashboard Components

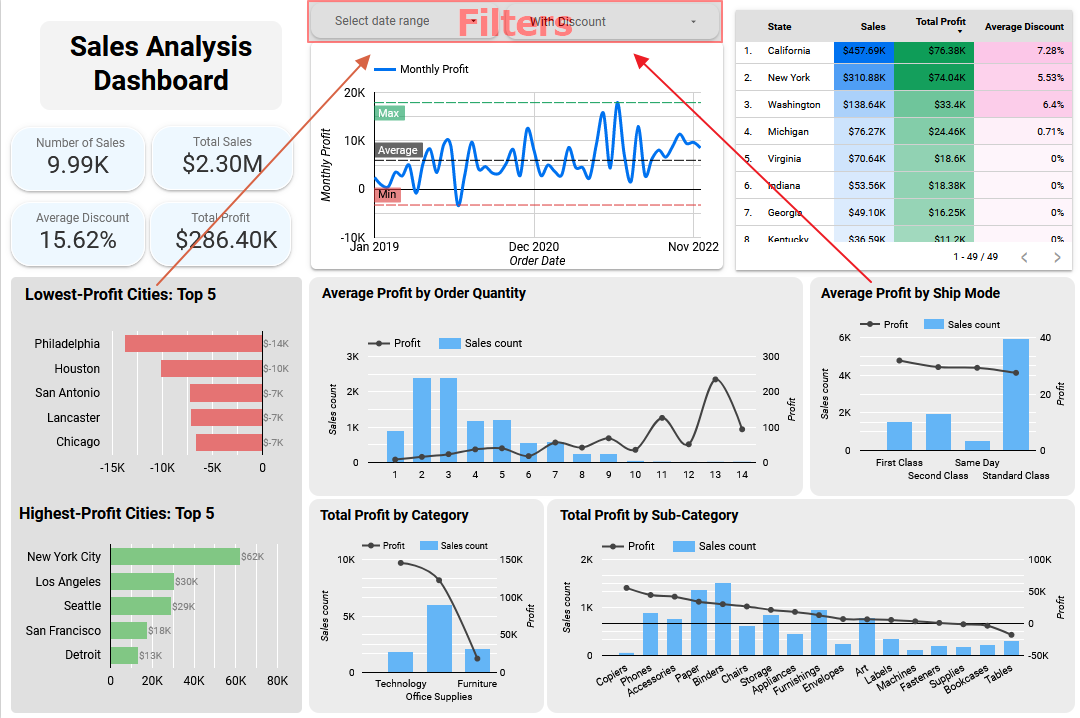
1. Filters for Precision

  • Date Filter: Pinpoint specific time frames for detailed analysis, tracking changes and trends over defined periods.
  • Discount Variable Filter: Choose between sales with or without discounts to understand the impact on profit and sales metrics

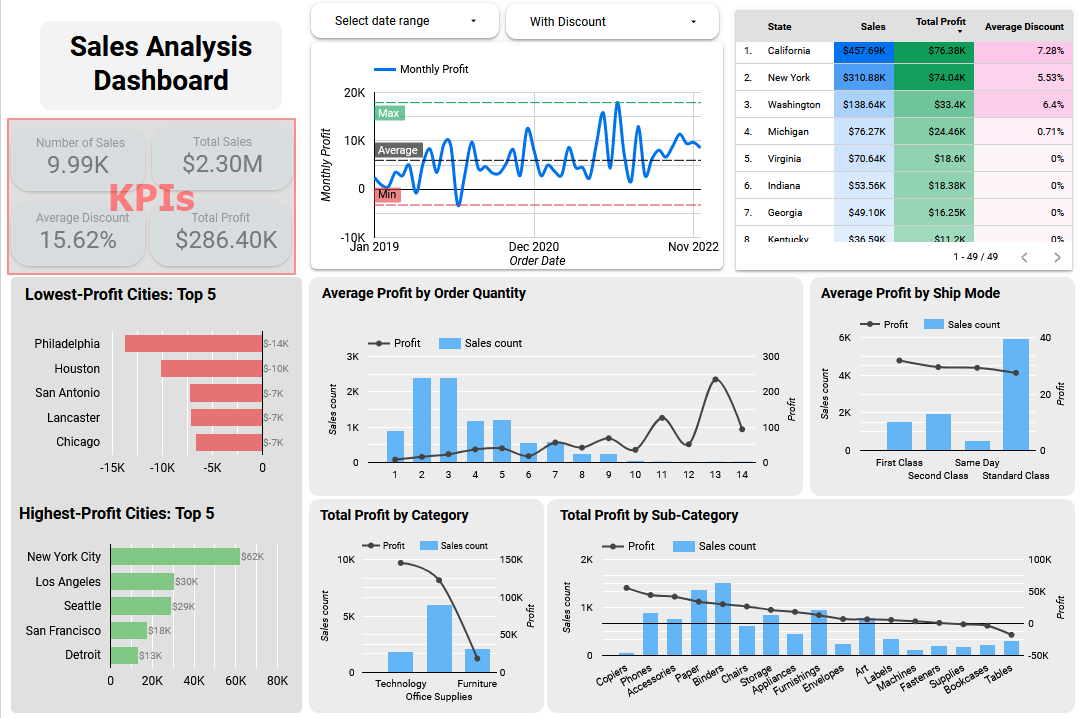
2. Performance Snapshot with KPIs

  • Number of Orders: Track sales activity by monitoring the volume of orders.
  • Total Sales (USD): Measure overall revenue generation for a holistic view of sales performance.
  • Total Profit (USD): Assess profitability by factoring in costs and revenue.
  • Average Discount for Discounted Orders: Understand the impact of discounts on sales, providing insights into customer behavior.

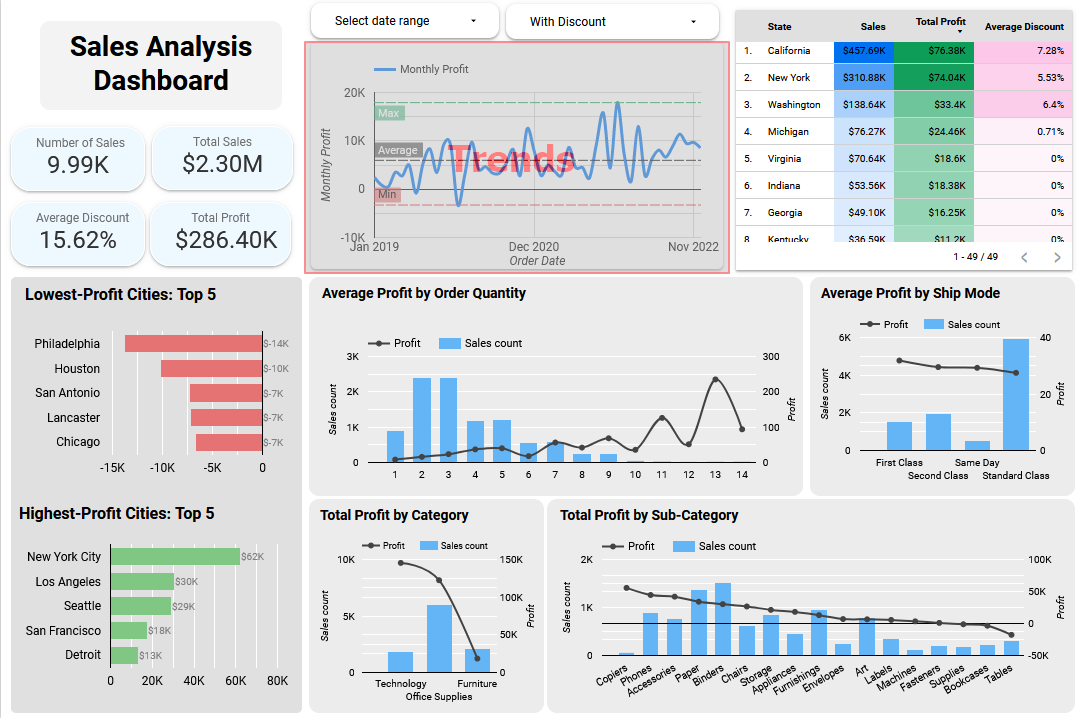
3. Insightful Trends with Visuals

Monthly Time Series Chart: Visualize historical profit trends over the last three years, enabling the identification of patterns and seasonality.

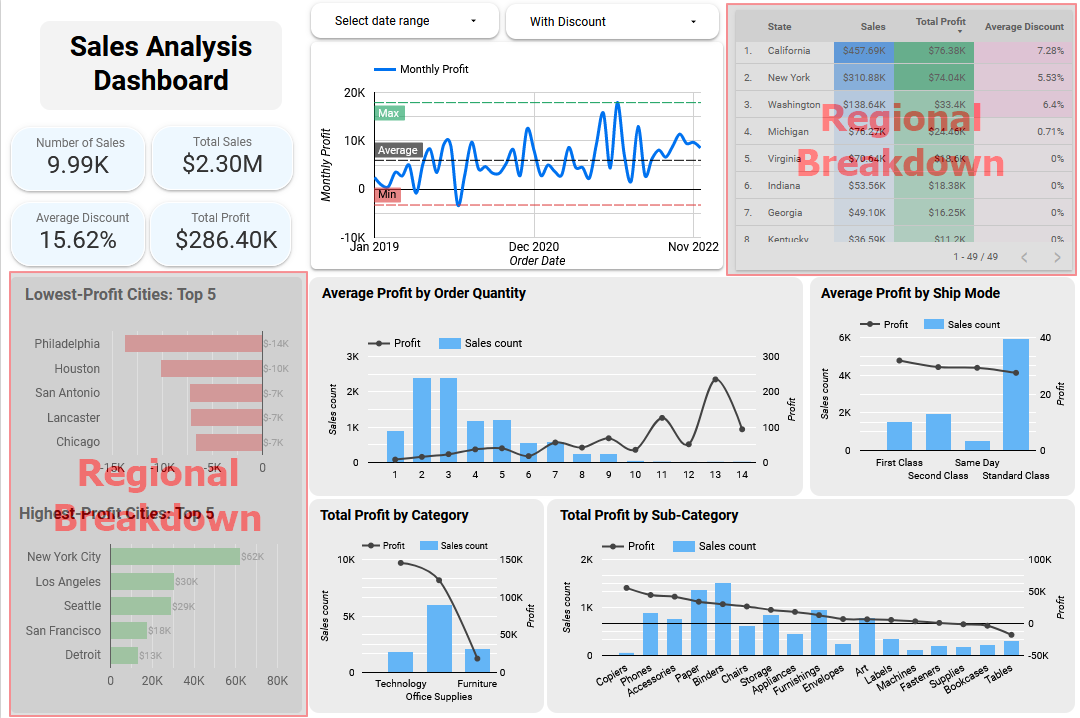
4. Regional Breakdown and Strategic Focus

  • State-Wise Observations: Dive into a detailed table offering insights into sales, profit, and average discount on a state-by-state basis.
  • Top and Bottom Performers: Bar charts highlighting the top five cities with the highest and lowest profits, facilitating strategic focus and optimization.

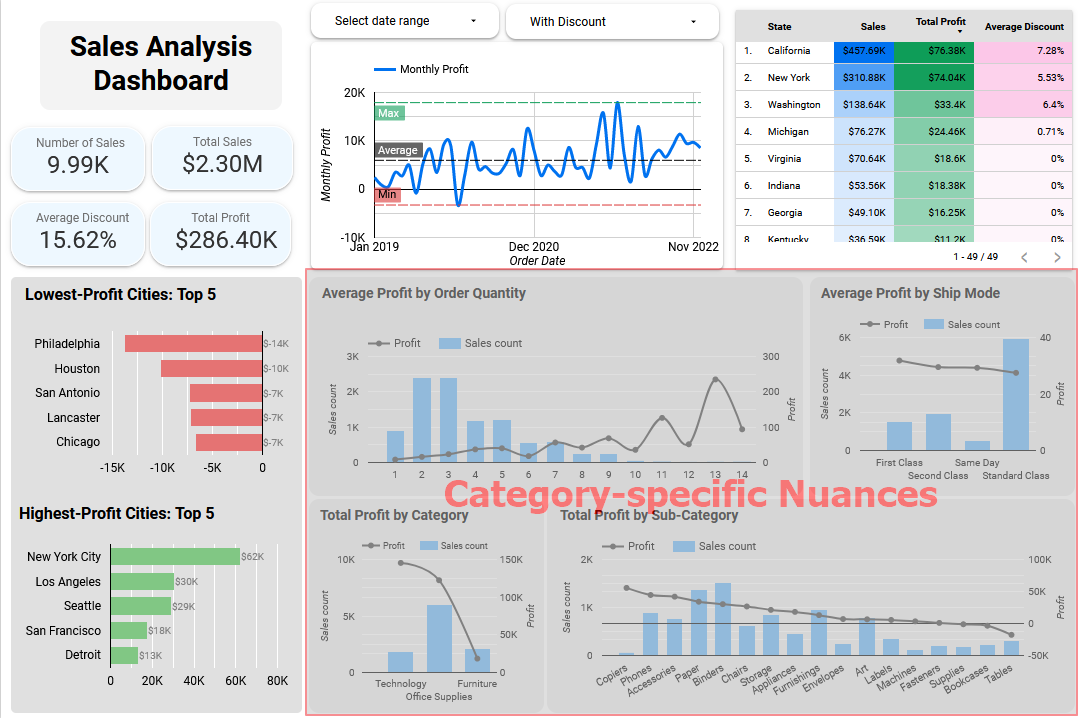
5. Category-specific Nuances

Combo Charts for In-depth Analysis: Four combo charts providing insights into total orders and total profit across different categories.

  • Order Quantity: Understand the volume of orders across various product categories.
  • Ship Mode: Analyze the impact of different shipping modes on sales and profit.
  • Product Category: Explore the performance of different product categories.
  • Product Subcategory: Dive deeper into subcategories for more nuanced insights

Why the Sales Analysis Dashboard was Invaluable?

Discover the profound impact of our E-commerce Sales Analysis Dashboard, a transformative tool that goes beyond numbers, unraveling insights and paving the way for strategic decisions.

Strategic Decision-Making


✔️ In-depth analysis empowers the business to make informed decisions, allowing for strategic adjustments and optimization of resources.

✔️ Insights into discount impact provide a nuanced understanding of customer behavior, aiding in tailored marketing strategies.

Regional Performance Optimization


✔️ Identification of top and bottom-performing cities allows the business to strategically focus efforts on high-potential areas and address under performance.

✔️ By addressing regional variations, businesses can maximize profits by aligning strategies with specific market needs.

Category-Specific Tailoring


✔️ Understanding category-specific trends enables the business to tailor marketing strategies for different product types and shipping modes.

✔️ Precise insights aid in allocating resources effectively, ensuring optimal results for various product categories.

Scalability and Adaptability


✔️ Designed with scalability in mind, the dashboard accommodates business growth, ensuring continued relevance and effectiveness.

✔️ The dashboard's flexibility allows it to evolve with changing business requirements, providing ongoing insights into a dynamic e-commerce landscape.

Play with the Dashboard

Use the dashboard to get instant insights, apply filters and select different date ranges

Real-Life Cases: Diverse Applications of an E-commerce Sales Dashboard

Explore how businesses across various industries can use the power of our E-commerce Sales Analysis Dashboard to navigate challenges, optimize strategies, and achieve remarkable success.

Fashion Retailer - Seasonal Trend Optimization

❌ Problem: Fluctuating sales during seasons.
✔️ Solution: Leveraged the Monthly Time Series Chart to identify seasonal trends, optimizing inventory and marketing strategies accordingly.

Cosmetics Brand - Discount Strategy Refinement

❌ Problem: Unclear impact of discounts on sales.
✔️ Solution: Analyzed Average Discount KPI to refine discount strategies, resulting in increased customer engagement.

Tech Gadgets Store - Top Performer Replication

❌ Problem: Difficulty in replicating success in other cities.
✔️ Solution: Identified successful strategies from Top and Bottom Performers charts, replicating them in underperforming cities.

Outdoor Equipment Retailer - Trend Analysis for Inventory Planning

❌ Problem: Overstocking or understocking issues.
✔️ Solution: Utilized Monthly Time Series Chart to analyze sales trends, optimizing inventory planning for different seasons.

Beauty Products E-commerce - Customer Loyalty Boost

❌ Problem: Low customer retention rates.
✔️ Solution: Analyzed customer behavior with filters and KPIs to implement targeted loyalty programs, increasing customer retention.

Electronics Store - Category-Specific Campaigns

❌ Problem: Inconsistent sales across product categories.
✔️ Solution: Utilized Combo Charts to tailor marketing campaigns for each product category, leading to improved sales across the board.

Furniture Retailer - Regional Expansion Insights

❌ Problem: Planning for expansion into new regions.
✔️ Solution: Utilized State-Wise Observations to identify potential cities for expansion based on existing performance.

Home Decor E-shop - Customer Demographic Targeting

❌ Problem: Generic marketing strategies not yielding expected results.
✔️ Solution: Employed filters and KPIs to target specific demographics, leading to more personalized and effective marketing.

Pet Supplies Store - Category Expansion Decision

❌ Problem: Considering expanding product categories.
✔️ Solution: Explored Combo Charts to evaluate potential categories for expansion, ensuring alignment with customer preferences.

Sports Equipment Retailer - Marketing Budget Optimization

❌ Problem: Inefficient allocation of marketing budget.
✔️ Solution: Leveraged insights from State-Wise Observations and Combo Charts to optimize marketing budgets for each region and product category.

In today’s digital age, data-driven decision-making is essential for advertising success. If you’re a small business or startup seeking to elevate your Facebook advertising strategy and maximize your ROI, you’ve arrived at the perfect solution. We’re thrilled to introduce our bespoke Looker Studio Facebook Ad Analysis Dashboard – a potent and interactive tool designed to revolutionize your approach to ad campaigns.

Motivation for a New Solution

Monitoring Facebook ads can be a complex task, often falling short of providing the in-depth details advertisers need. The Looker Studio Facebook Ad Analysis Dashboard is the solution you’ve been waiting for. It’s designed to address the challenges of Facebook ads and offer you a more detailed, user-friendly, and interactive alternative.

What Our Dashboard Offers

Our Looker Studio dashboard isn’t just another analytics tool; it’s your gateway to valuable insights and informed decision-making. Let’s explore the diffrent ways this dashboard can reshape your advertising strategy:

  1. Tailor-Made Insights: Customize Your Analysis Our dashboard includes three flexible filters – date range, campaign ID, and ad ID – enabling you to fine-tune your analysis. This customization ensures that your data aligns seamlessly with your unique advertising needs.

  2. Real-Time Data Updates Outdated information is a thing of the past. Our dashboard updates in real-time, ensuring you always have access to the latest data, a crucial feature for staying ahead in your campaigns.

  3. Holistic Campaign Evaluation No more juggling spreadsheets. The dashboard offers key performance indicators (KPIs) like impressions, conversions, clicks, spending, and cost per click in an easily digestible format.

  4. Audience Insights Utilize demographic donut charts to identify which age groups and genders respond most favorably to your ads. This critical insight allows you to craft more targeted campaigns.

  5. Day-of-Week Optimization Discover the most profitable days of the week for your campaigns. Allocate your budget intelligently for maximum impact.

  6. Long-Term Trends Understand how your campaigns are performing over time with the monthly line chart. Identify trends and seasonality to make proactive adjustments.

  7. Comparative Analysis Easily compare the performance of different campaigns or ads within the table view. This feature identifies top-performing assets and areas needing improvement.

  8. Conversion Funnel Analysis Drill down from impressions to conversions within the table view to identify where your funnel might be leaking, helping you streamline your strategy.

  9. Cost-Effective Decision Making Calculate the cost per click across all campaigns and ads, ensuring you’re optimizing your budget for the best results.

  10. Ad-Hoc Exploration Empower yourself to explore ad-hoc questions and scenarios with cross-filtering. This feature enables you to uncover insights and make data-driven decisions on the fly.

Our Looker Studio Facebook Ad Analysis Dashboard isn’t just a tool; it’s a catalyst for success in today’s digital advertising landscape. Whether you’re managing a single campaign or juggling multiple, it empowers you to make informed decisions and achieve your advertising goals.

If you’re ready to supercharge your Facebook advertising efforts, we’re here to help. Contact us today to create a customized dashboard that aligns with your unique requirements and delivers actionable insights. Don’t settle for guesswork when it comes to your advertising. Embrace data-driven decisions and turn your advertising campaigns into success stories!

Your data deserves better, and our Looker Studio dashboard is here to deliver it. Get in touch today to embark on your data-driven journey.

Contact