

Unlock the full potential of the business data with our Revenue Analysis Dashboard. Tailored for precision, this dynamic tool provides comprehensive insights into revenue trends, costs, and customer demographics.
⦿ Incomplete Revenue Visibility: Challenges in obtaining a comprehensive view of revenue performance across diverse dimensions such as age, gender, and product categories.
⦿ Limited Demographic Insights: Absence of detailed insights into customer demographics hampers targeted marketing efforts and personalized strategies.
⦿ Strategic Analysis Gaps: Lack of a centralized platform for strategic revenue analysis, hindering the ability to identify trends and areas for optimization.
⦿ Holistic Revenue Overview: Develop a dashboard that offers a holistic view of revenue streams, providing actionable insights for strategic decision-making.
⦿ Enhanced Demographic Understanding: Integrate demographic insights into revenue analysis to tailor marketing strategies based on customer age, gender, and preferences.
⦿ Strategic Optimization: Establish a centralized platform for strategic revenue analysis, enabling the identification of trends and areas for optimization.
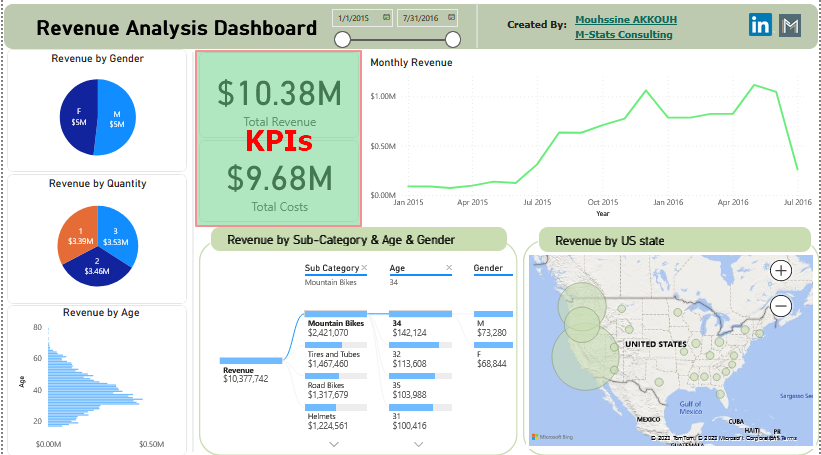
Track overall financial health with essential KPIs, offering a quick overview of total revenue and costs.
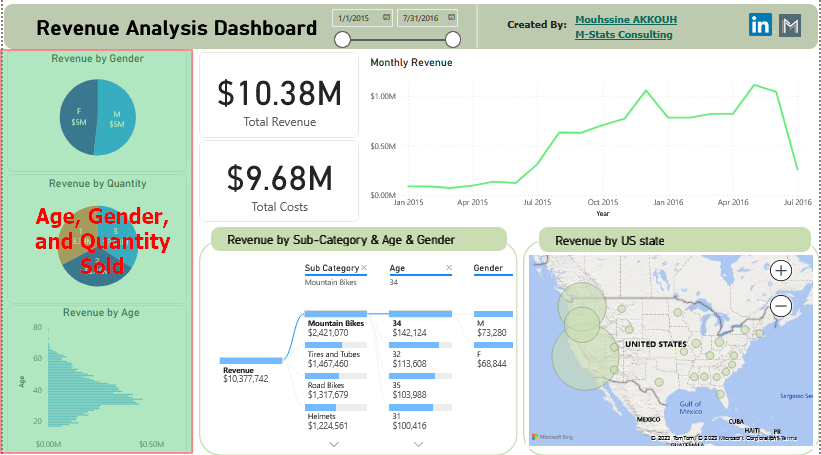
Gain insightful perspectives on revenue dynamics with dedicated charts showcasing trends based on age, gender, and quantity sold.
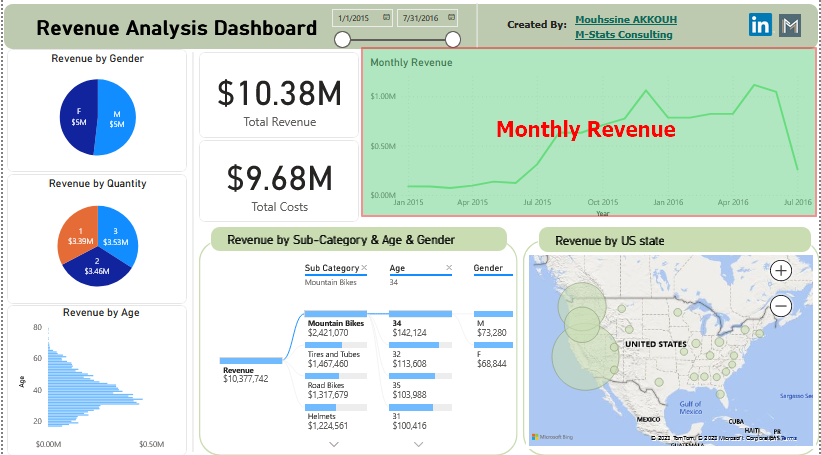
Dive into temporal revenue trends with the Time Series Chart, identifying patterns and seasonality for strategic planning.
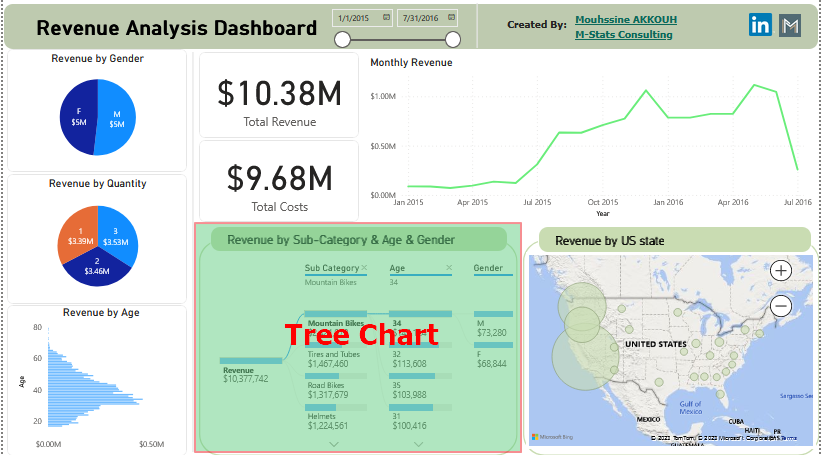
Explore hierarchical relationships with the Tree Chart, revealing insights into revenue distribution across categories, age groups, and gender.

Gain a geographic perspective with the Geographic Map, visualizing revenue distribution across U.S. states for targeted strategies.
Check the importance of our Revenue Analysis Dashboard, a simple and useful tool that goes beyond conventional metrics, providing added value to the business revenue analysis.
✔️ Unlock Comprehensive Insights: Gain a 360-degree understanding of sales performance, examining age, gender, quantity sold, and critical factors.
✔️ Nuanced Analysis for Decision-Making: Make informed decisions by delving into the nuances of demographic data, allowing strategic planning.
✔️ Strategic Expansion and Regional Insights: Identify high-performing states for strategic expansion, guided by the Geographic Map, and for Tailored regional marketing initiatives.
✔️ Optimized Offerings and Targeted Strategies: Explore revenue distribution across product categories for optimized offerings, and uncover how age and gender influence revenue, facilitating targeted strategies for specific customer segments.
✔️ Demographic Tailoring for Engagement: Leverage detailed demographic insights to tailor marketing strategies, resonating with specific age groups and genders.
✔️ Proactive Decision-Making with Real-Time Insights: Utilize real-time monitoring for timely trend identification and proactive adaptation of strategies.
Explore how our Revenue Analysis Dashboard can be extended in diverse real-life scenarios, providing actionable insights and driving success in various business contexts:
❌ Problem: In a retail setting, understanding customer demographics and their purchasing behaviors is crucial for targeted marketing and inventory management.
✔️ Solution: The Revenue Analysis Dashboard identified top-performing product categories, enabling optimized inventory management and targeted marketing strategies based on customer demographics.
❌ Problem: A company considering expansion wanted to pinpoint lucrative regions for growth and marketing focus.
✔️ Solution: The Geographic Map feature helped identify high-performing states, guiding the company's expansion strategy and regional marketing efforts for maximum impact.
❌ Problem: A seasonal business sought to enhance its marketing efforts during peak months.
✔️ Solution: Monthly revenue trends highlighted in the dashboard allowed the business to implement targeted seasonal marketing strategies, ensuring maximum impact during peak periods.
❌ Problem: A multinational company wanted to assess the performance of its products in different regions.
✔️ Solution: The dashboard's geographic insights provided a clear view of regional performance, aiding the company in tailoring marketing strategies to specific regions and demographics.
❌ Problem: A business sought to understand how its revenue performance compared to competitors in specific regions.
✔️ Solution: The Geographic Map allowed for a visual comparison of revenue distribution, enabling the business to benchmark its performance against competitors and identify areas for improvement.
❌ Problem: An e-commerce business sought to improve its revenue streams by identifying age and gender preferences among its customer base.
✔️ Solution: The dashboard's detailed demographic insights empowered the business to tailor its online shopping experience, leading to increased customer engagement and higher conversion rates.
❌ Problem: A business with a diverse product portfolio aimed to optimize offerings based on revenue distribution.
✔️ Solution: The dashboard's insights into revenue across product categories facilitated strategic decision-making, enabling the business to focus on high-performing products and refine its portfolio.
❌ Problem: A marketing team needed to create campaigns that resonated with specific age groups and genders.
✔️ Solution: Demographic insights from the dashboard guided the development of targeted marketing campaigns, resulting in increased customer engagement and improved campaign effectiveness.
❌ Problem: A pricing team aimed to implement dynamic pricing based on customer demographics and regional variations.
✔️ Solution: Revenue insights by age, gender, and geography guided the implementation of dynamic pricing strategies, optimizing pricing for different customer segments and regions.
❌ Problem: A company launching new products needed to evaluate their success and understand their appeal among different demographics.
✔️ Solution: The dashboard provided detailed insights into the performance of new products, helping the company refine its marketing strategies and product offerings based on demographic preferences.