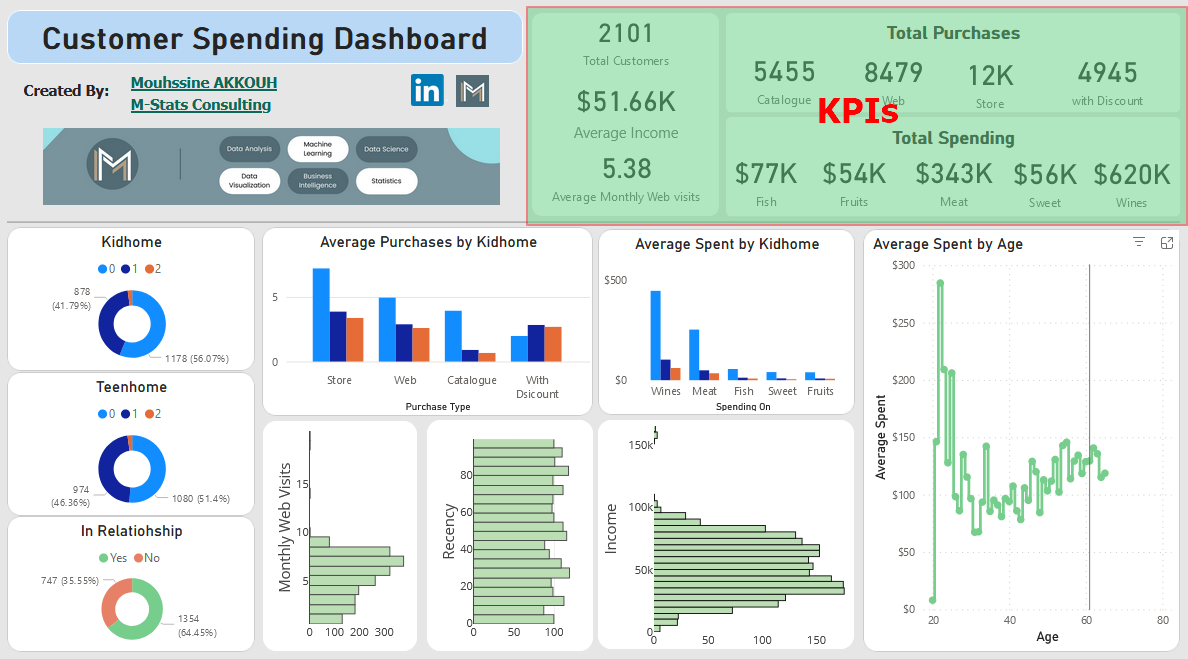


Explore the diverse facets of customer spending through a lens that goes beyond mere transactions. This comprehensive dashboard delves into key performance indicators (KPIs) and detailed analytics, providing the business with the means to understand customer behavior, optimize offerings, and enhance overall profitability.
⦿ Understanding Customer Behavior:
Optimizing Product Offerings:
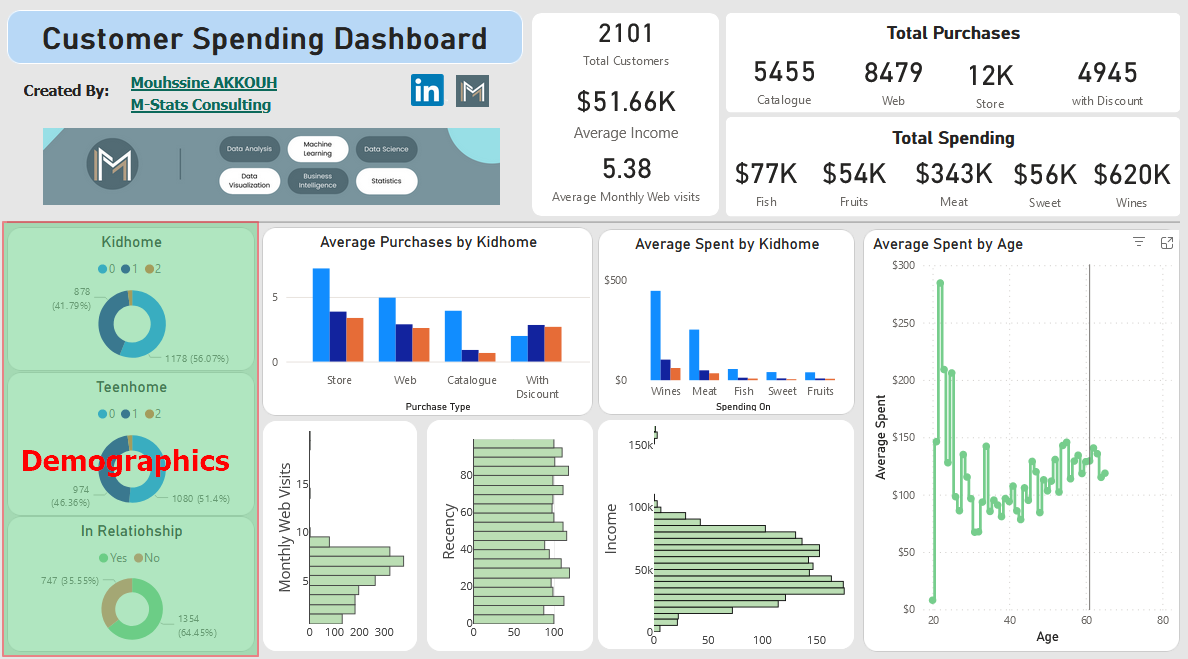
⦿ Holistic Customer View: Provide a comprehensive view of customer demographics and behaviors to gain insights into customer profiles, helping tailor strategies based on demographics.
⦿ Purchasing Pattern Insights: Analyze different purchase types to identify trends and preferences to optimize inventory and marketing strategies based on purchasing patterns.
⦿ Demographic Impact Assessment: Understand the impact of demographics on customer spending to tailor offerings and promotions based on the demographics that significantly impact spending.
⦿ Web Interaction Understanding: Gain insights into customer web interactions and their correlation with spending to refine online strategies and improve the digital customer experience.
⦿ Optimizing Marketing Strategies: Utilize insights for targeted marketing and engagement to deploy more effective marketing campaigns based on customer preferences.
Visualize customer distribution based on key demographic factors, unraveling valuable patterns.
Examine the distribution of customers based on household composition, including the presence of kids and teenagers.
Analyze the impact of relationship status on customer engagement and spending behaviors.
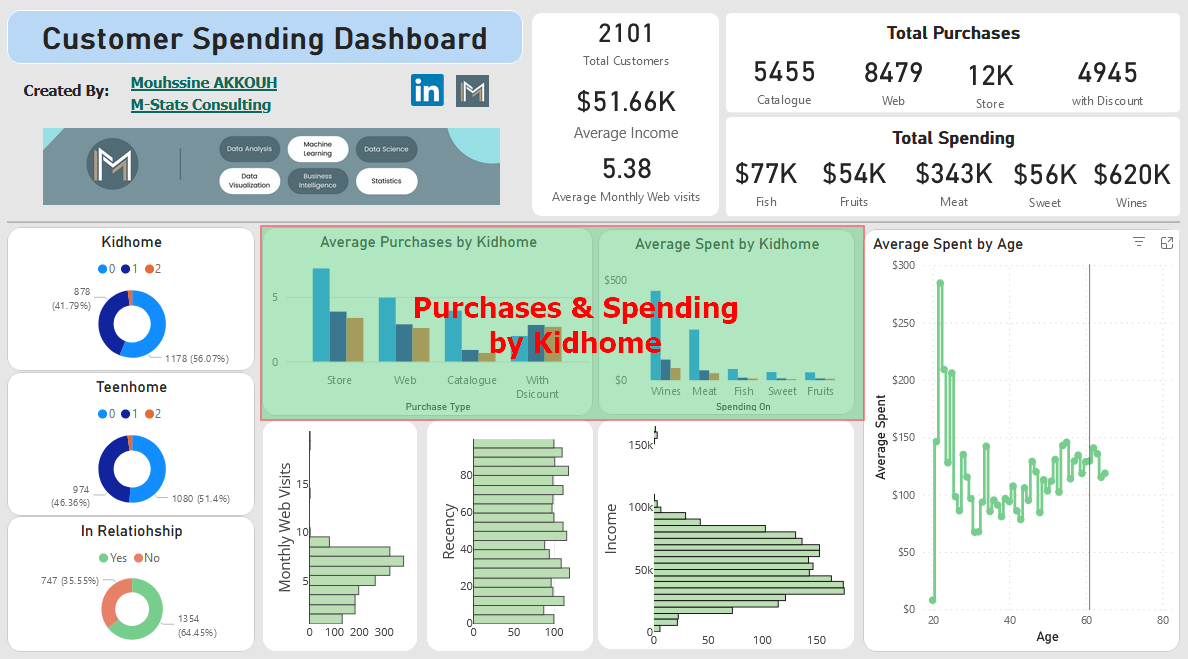
Discover the relationship between the presence of kids at home, and customer spending patterns.
Discover the profound significance of the Customer Spending Dashboard in explaining consumer behavior and driving strategic decisions. This invaluable tool offers multifaceted insights that empower businesses to optimize marketing strategies, enhance customer satisfaction, and drive overall growth.
✔️ Targeted Marketing: Tailor marketing campaigns based on the nuanced understanding of customer demographics, ensuring personalized engagement.
✔️ Product Optimization: Refine product offerings by analyzing spending patterns, aligning your inventory with customer preferences.
✔️ Strategic Family-Centric Approaches: Craft targeted strategies for households with or without kids, optimizing marketing efforts and product offerings accordingly.
✔️ Customized Product Recommendations: Leverage insights into family dynamics to provide personalized product recommendations, enhancing the customer experience.
✔️ Adaptable Marketing Strategies: Dynamically adjust marketing strategies based on real-time data, responding promptly to evolving consumer behaviors.
✔️ Operational Efficiency: Enhance operational efficiency by aligning inventory management and product availability with customer demand.
Explore how the Customer Spending Dashboard transcends industries and scenarios, offering versatile applications that cater to unique business needs. These real-life cases showcase the adaptability and effectiveness of our dashboards in driving informed decision-making and achieving tangible results.
❌ Problem: Understanding varied spending patterns across different demographic segments.
✔️ Solution: Utilized dashboard insights to tailor promotional offers, leading to increased customer engagement and satisfaction.
❌ Problem: Ineffective marketing strategies that did not account for family composition.
✔️ Solution: Utilized insights into spending patterns based on the presence of kids, leading to more effective family-centric marketing campaigns.
❌ Problem: Generic membership packages not resonating with diverse customer needs.
✔️ Solution: Utilized dashboard insights to create customized membership plans aligned with customer preferences, resulting in increased sign-ups.
❌ Problem: High subscription churn rates due to generic box offerings.
✔️ Solution: Used dashboard insights to tailor subscription boxes, resulting in increased customer retention and positive feedback.
❌ Problem: Overcoming generic product recommendations leading to reduced user engagement.
✔️ Solution: Implemented dashboard insights to curate personalized product suggestions, resulting in a significant uptick in conversion rates.
❌ Problem: Limited understanding of customer preferences leading to suboptimal inventory management.
✔️ Solution: Leveraged the dashboard to analyze spending on different product categories, allowing for strategic adjustments in inventory.
❌ Problem: Limited understanding of guest preferences and spending habits.
✔️ Solution: Leveraged the dashboard to analyze spending on amenities, enabling personalized guest services and increased satisfaction.
❌ Problem: Limited insight into the preferences of high-value customers.
✔️ Solution: Leveraged the dashboard to analyze spending on luxury items, enabling personalized experiences for high-net-worth clients.