mouhssine2

Sales Analysis Dashboard with Excel

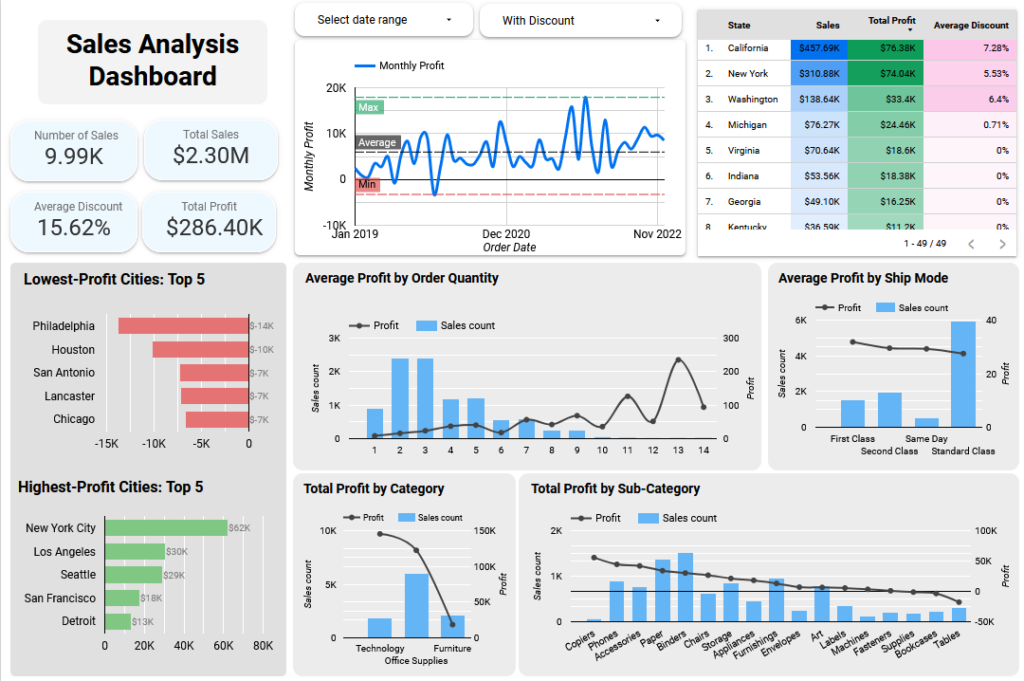
Excel Sales Analysis Dashboard In the dynamic landscape of e-commerce, understanding sales performance is key to strategic decision-making and business growth. Dive into our Excel Sales Analysis Dashboard, meticulously crafted to empower you with insights into the nuances of sales, profit, and customer behavior. Uncover trends, optimize strategies, and elevate the e-commerce capabilities. Contact US …

Sales Analysis Dashboard with Excel Read More »

Customer Spending Analysis Dashboard

Customer Spending Analysis Dashboard Explore the diverse facets of customer spending through a lens that goes beyond mere transactions. This comprehensive dashboard delves into key performance indicators (KPIs) and detailed analytics, providing the business with the means to understand customer behavior, optimize offerings, and enhance overall profitability. Contact US Portfolio Scroll Down https://m-stats.me/wp-content/uploads/2023/12/Customer-Spending-Analysis-Dashboard.mp4 Business Understanding …

Customer Spending Analysis Dashboard Read More »

Maximizing Insights with Revenue Analysis Dashboard

Maximizing Insights with Revenue Analysis Dashboard Unlock the full potential of the business data with our Revenue Analysis Dashboard. Tailored for precision, this dynamic tool provides comprehensive insights into revenue trends, costs, and customer demographics. Contact US Portfolio Scroll Down https://m-stats.me/wp-content/uploads/2023/12/Revenue-Analysis-Dashboard.mp4 Business Understanding Problems ⦿ Incomplete Revenue Visibility: Challenges in obtaining a comprehensive view of …

Maximizing Insights with Revenue Analysis Dashboard Read More »

Quality Control Dashboard: Enhancing Precision in Manufacturing

Quality Control Dashboard: Enhancing Precision in Manufacturing In manufacturing, ensuring the highest quality standards is paramount. Our Quality Control Dashboard, crafted with Power BI, provides a comprehensive view of key performance indicators (KPIs) and crucial metrics to empower auditors and decision-makers in maintaining and improving product quality. Explore how this dashboard enhances quality control in …

Quality Control Dashboard: Enhancing Precision in Manufacturing Read More »

Streamlining HR Management and Analysis with Power BI

Streamlining HR Management and Analysis with Power BI In the dynamic landscape of human resources, understanding and managing key metrics are essential for fostering a productive and satisfied workforce. Examine our HR Management Report powered by Power BI, designed to provide a comprehensive view of critical KPIs, attrition patterns, and employee satisfaction, all aimed at …

Streamlining HR Management and Analysis with Power BI Read More »

Navigate the E-commerce Store Sales using a Looker Studio Dashboard

Navigate the E-commerce Store Sales using a Looker Studio Dashboard Crafted to address losses in specific cities, this dynamic tool propels the business into a realm of comprehensive sales insights. Uncover profit sources, strategically optimize, and let data-driven decisions chart the path to e-commerce excellence. Contact US Portfolio Scroll Down https://m-stats.me/wp-content/uploads/2023/12/Navigate-the-E-commerce-Store-Sales-using-a-Looker-Studio-Dashboard.mp4 Business Understanding Problems ⦿ City-Specific …

Navigate the E-commerce Store Sales using a Looker Studio Dashboard Read More »

Sales | Profit Forecasting Web App

Sales | Profit Forecasting Web App Streamline your forecasting process with a tool designed for business owners, not just data experts. Contact US Portfolio Scroll Down Business Understanding Problem ⦿ The decision to build the Time Series Forecasting Web App originated from a keen awareness of the challenges businesses face when dealing with forecasting and …

Sales | Profit Forecasting Web App Read More »

Impact of EWOM on Restaurant Purchase Intentions via Snapchat

An in-depth quantitative research analysis on the influence of electronic word of mouth (EWOM) through the Snapchat platform on restaurant purchase intentions. This study focuses on the vibrant platform of Snapchat and its implications for residents of Saudi Arabia. With participants spanning various age groups, educational backgrounds, and income levels, this research paints a comprehensive picture of how EWOM impacts consumer behavior.

Objectives:

The primary goal was to examine the data and construct statistical models to answer our research questions, while exploring the conceptual framework.

Survey-Based Dashboard for Romantic Relationship Behaviors and Family Influence

A Survey-Based Dashboard for Romantic Relationships and Family Dynamics Our Relationship Research Dashboard was built as an interactive and user-friendly tool to help the discovery of insights from a study investigating romantic relationship behaviors and the impact of the family environment Contact US Portfolio Scroll Down https://m-stats.me/wp-content/uploads/2023/10/A-Survey-Based-Dashboard-for-Romantic-Relationships-and-Family-Dynamics.mp4 Project Understanding Problems Navigating the intricate terrain of …

Survey-Based Dashboard for Romantic Relationship Behaviors and Family Influence Read More »

Telecom Churn Analysis & Prediction Dashboard

Telecom Churn Analysis & Prediction Dashboard In a world of evolving telecom challenges, imagine having a tool at your fingertips that not only understands customer behavior but predicts it. Welcome to the Telecom Churn Analysis Dashboard – where data meets strategy to help you decode customer churn, make smarter decisions, and propel your business into …

Telecom Churn Analysis & Prediction Dashboard Read More »