

In the digital age, a website is often the first interaction a potential customer has with your business. Ensuring a smooth, engaging user experience is crucial. This is where our Bounce Rate Dashboard comes into play, offering insights to help you understand and tackle the bounce rate challenge effectively.
⦿ Elevated Bounce Rates as Warning Signs: High bounce rates, where visitors navigate away from the website after viewing only one page, suggested a crucial issue in user retention.
⦿ User Experience Disconnect: The disparity between what visitors anticipated and what the website delivered pointed to potential shortcomings in user experience.
⦿ Absence of Real-Time Insights: The lack of real-time monitoring meant that the business operated without immediate insights into user interactions.
⦿ Need for Root Cause Identification: The challenge extended beyond acknowledging the bounce rate; there was a need to identify the specific factors contributing to this behavior.
⦿ Real-Time Monitoring: Enable the business to monitor bounce rates in real-time, providing immediate insights into user interactions on the website.
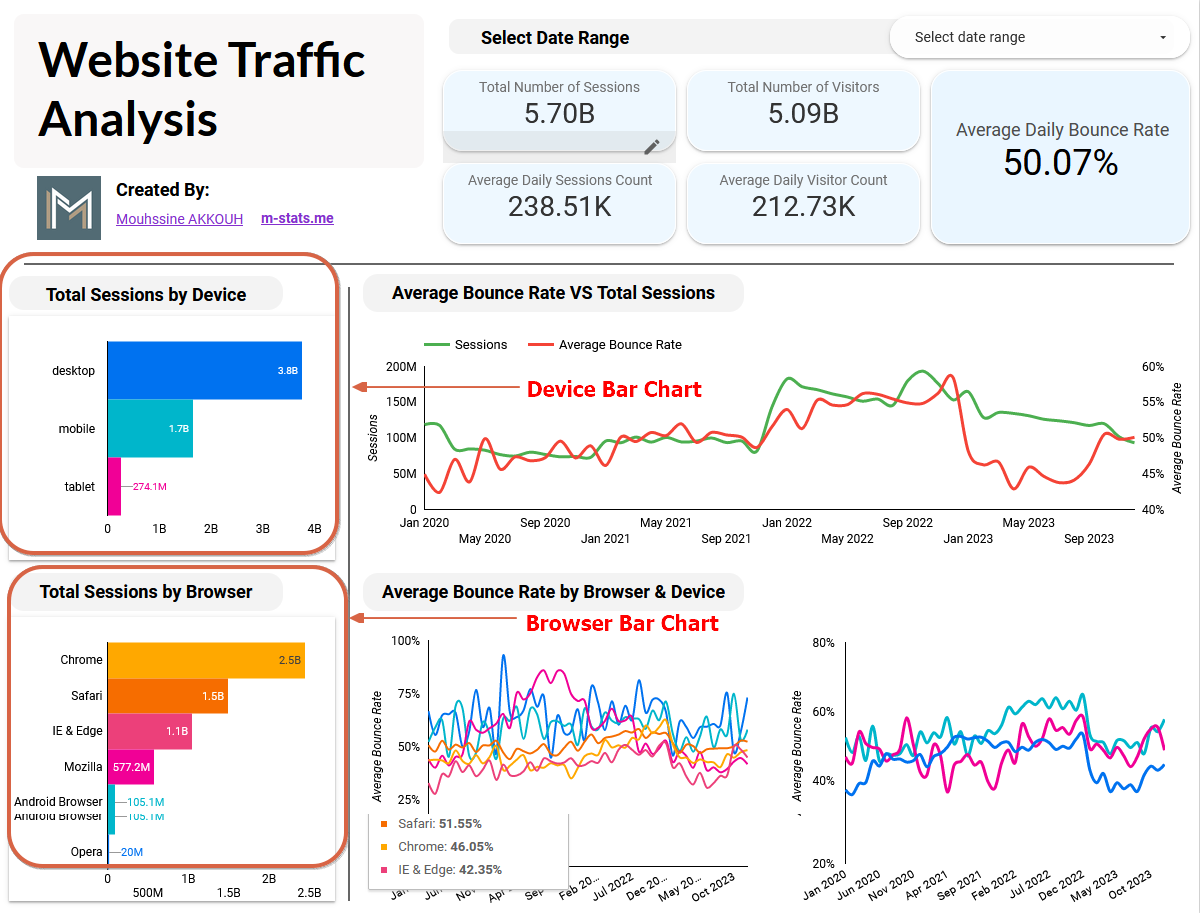
⦿ Identify Device and Browser Impact: Uncover which devices and browsers contribute most to bounce rates, facilitating targeted optimizations for specific platforms.
⦿ Assess Fix Effectiveness Over Time: Implement fixes to address identified issues and measure their impact over time, ensuring continuous improvement in user engagement.
⦿ Optimize for Responsive Design: Equip the business with insights to optimize the website for specific devices and browsers, ensuring a seamless experience for all users.
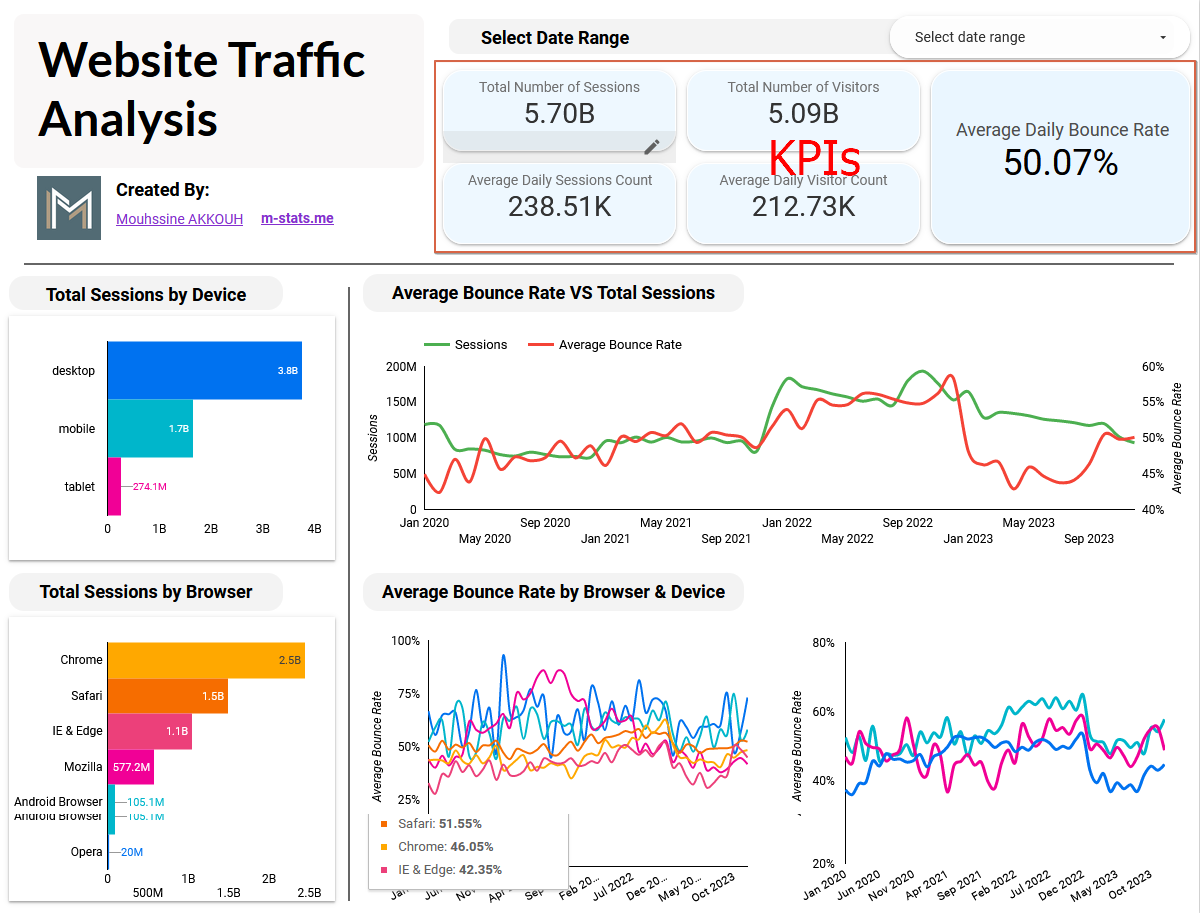
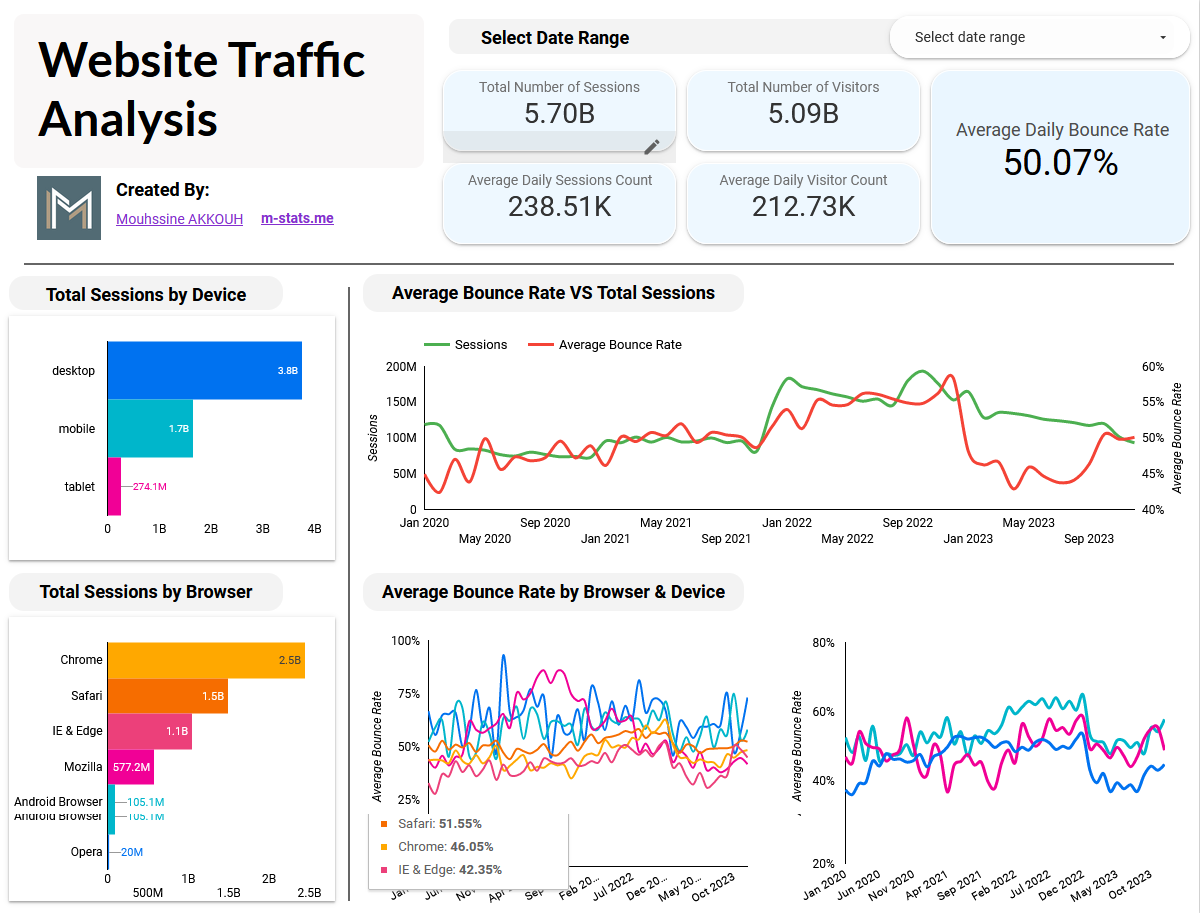
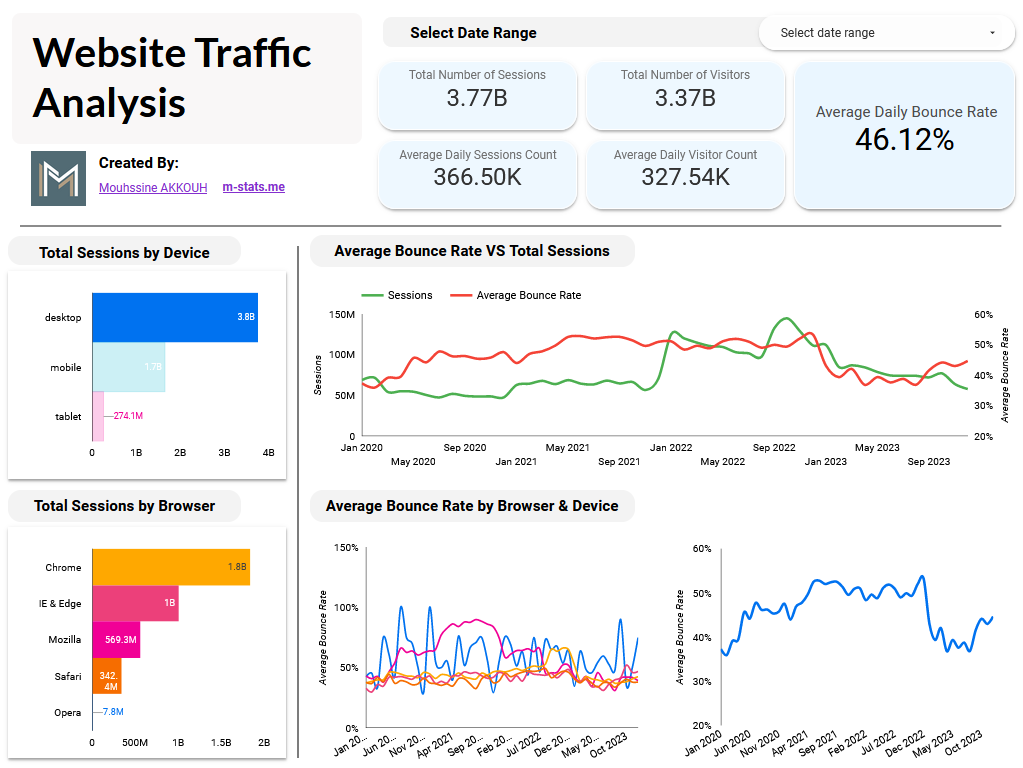
We tracked some key performance indicators to get a comprehensive overview of website traffic and engagement, and get a quick assessment of user interaction patterns.
In order to identifies the devices and the browsers that are most frequently used by visitors, we created two bar charts, that can be also used as filters.
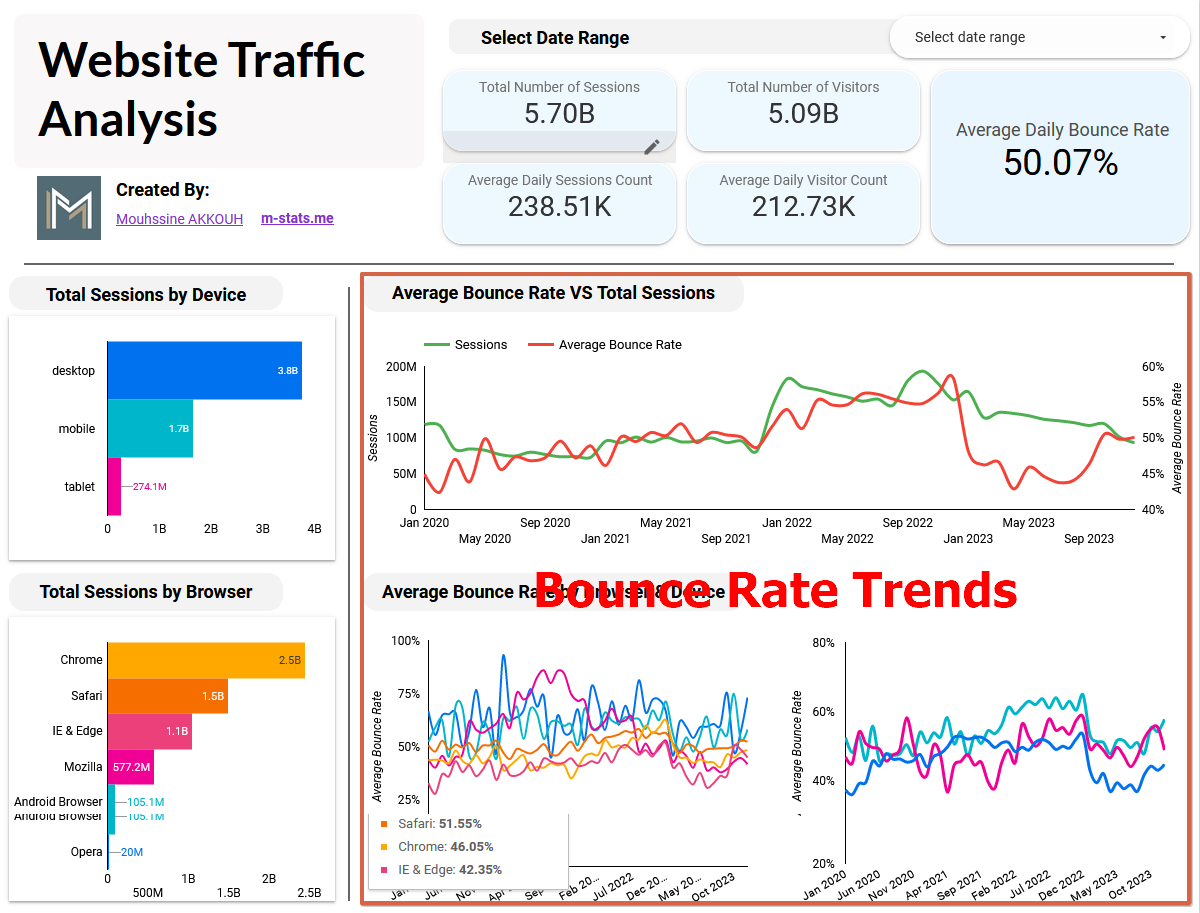
We created 3 different time series chart for the average monthly bounce rate vs Total sessions, and monthly bounce rate by device and browser.
✔️ Immediate Insights: Provided businesses with real-time monitoring, allowing them to observe user behaviors as they unfolded.
✔️ Proactive Issue Resolution: Enabled prompt identification of emerging issues, empowering businesses to take immediate action and minimize potential disruptions to user engagement.
✔️ Ongoing Fix Validation: Facilitated the implementation of fixes to address identified issues, with a built-in mechanism to measure their effectiveness over time.
✔️ Strategic Decision-Making: Equipped with key performance indicators (KPIs) and trends, fostering a data-driven approach for continuous improvement in website performance and user engagement.
✔️ Identification of Contributing Factors: Identified the specific devices and browsers contributing most to high bounce rates.
✔️ Tailored Solutions: Armed the business with insights to implement targeted optimizations for specific platforms, ensuring a seamless experience across diverse user contexts.
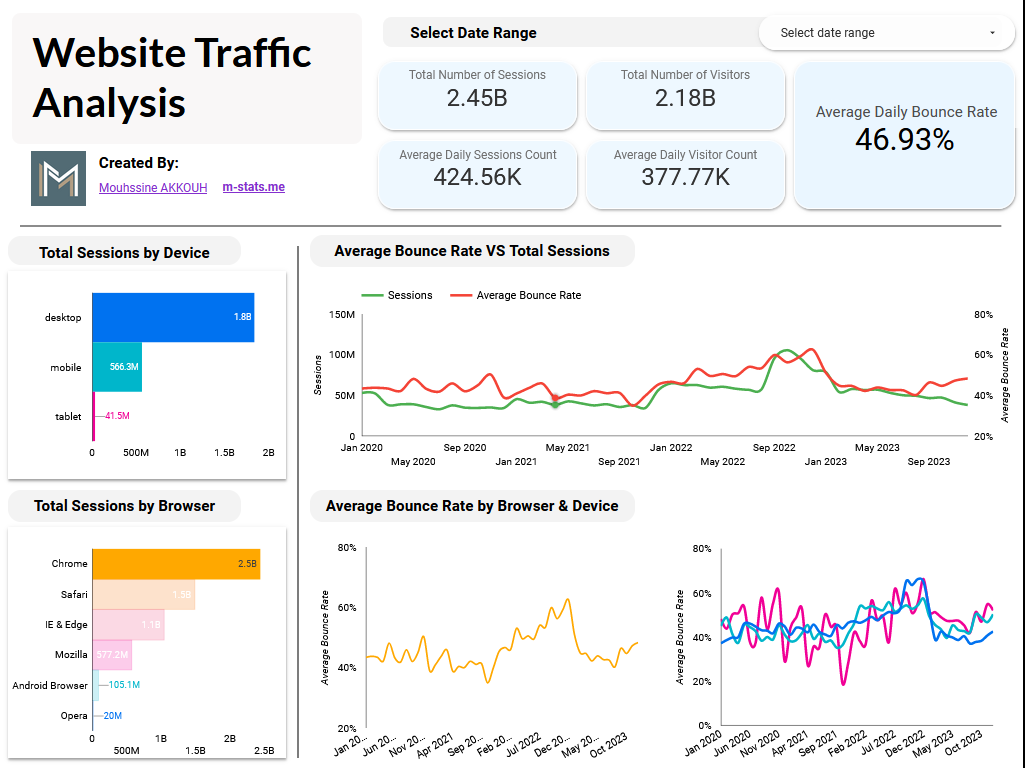
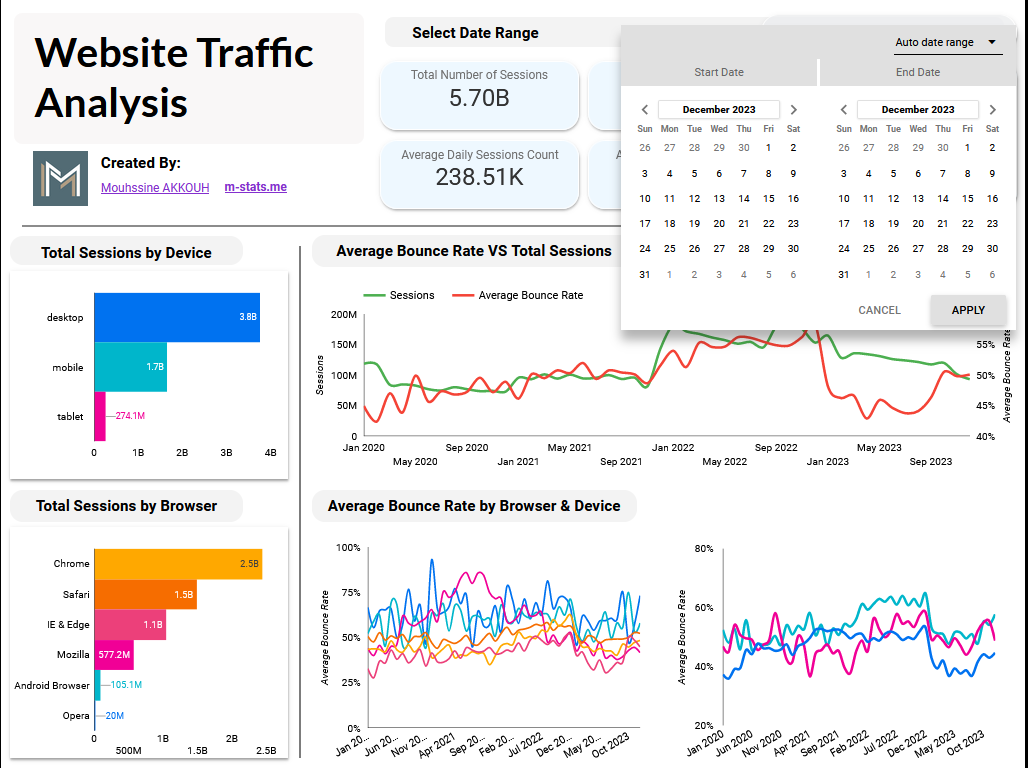
Use the dashboard to get instant insights, apply filters and select different date ranges
Harnessing the Bounce Rate Dashboard's methodology, businesses across diverse sectors can address specific challenges, enhance user experiences, and optimize performance. Here are some real-life use cases:
❌ Problem: High bounce rates on certain course pages indicate potential disinterest or navigation issues.
✔️ Solution: Implement the Bounce Rate Dashboard to identify problematic content, optimize course layouts, and enhance user engagement.
❌ Problem: A surge in bounce rates during the account creation process hinders user acquisition.
✔️ Solution: Deploy the dashboard to identify friction points, streamline onboarding processes, and enhance the overall new user experience.
❌ Problem: Bounce rates on certain news articles indicate potential content mismatch with audience expectations.
✔️ Solution: Leverage the dashboard to identify unpopular topics, tailor content to audience interests, and improve overall news article relevance.
❌ Problem: High bounce rates on appointment booking pages signal potential frustrations or complexities.
✔️ Solution: Integrate the dashboard to identify bottlenecks, simplify the booking process, and enhance the overall user experience for healthcare appointments.
❌ Problem: Users bouncing after signing up for free trials suggest potential dissatisfaction or confusion.
✔️ Solution: Implement the dashboard to identify stages causing disengagement, refine onboarding processes, and increase free trial conversion rates.
❌ Problem: Elevated bounce rates during the booking process signal potential hurdles in the user journey.
✔️ Solution: Utilize the dashboard to pinpoint stages causing disengagement, streamline the booking process, and tailor content for a seamless experience.
❌ Problem: High bounce rates on product pages suggest potential issues with content or presentation.
✔️ Solution: Employ the dashboard to analyze bounce rates, optimize product descriptions, and implement multimedia elements for increased engagement.
❌ Problem: Users bouncing off search results pages may signal difficulties in finding relevant job listings.
✔️ Solution: Apply the dashboard to analyze bounce rates, optimize search result layouts, and improve the user journey for job seekers.
❌ Problem: Elevated bounce rates on specific content categories may indicate poor content visibility or user disinterest.
✔️ Solution: Employ the dashboard to analyze category-wise bounce rates, refine content visibility algorithms, and improve overall engagement.
❌ Problem: High bounce rates during event registration may indicate a cumbersome registration process.
✔️ Solution: Leverage the dashboard to analyze bounce rates, streamline registration processes, and enhance user engagement for event attendees.