Before diving deep into the results of the customer segmentation project, it is essential to conduct exploratory data analysis (EDA) to get insights into the data. EDA is a crucial step in any data-driven project as it helps to understand the data distribution and identify any data quality issues.
Numerical Features:
We started the EDA by examining the summary statistics for numerical variables in the dataset, which are resumed in the bullet points below:
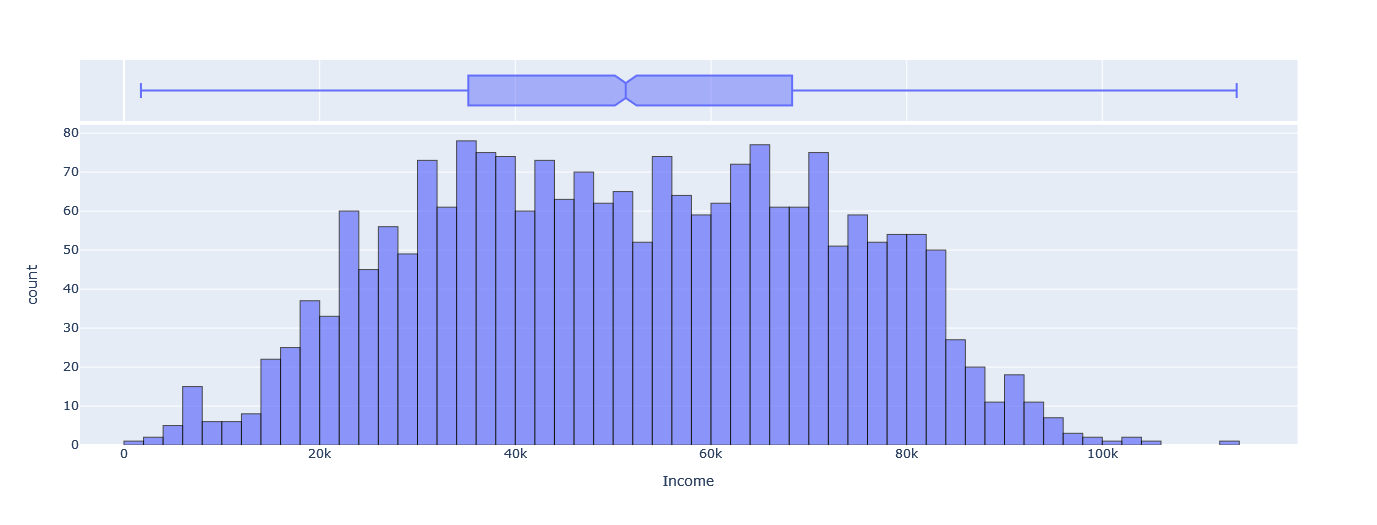
- Income: The mean income of our customers is $51622.09 with a standard deviation of $20713.06. The minimum income is $1730.00, and the maximum is $113734.00.
- Recency: The mean number of days since the last purchase is 49.01 days, with a standard deviation of 28.93 days. The minimum recency value is 0 days, while the maximum is 99 days.
- Customer For: The mean number of days since the customer’s first purchase is 353.72 days, with a standard deviation of 202.56 days. The minimum value is 0 days, and the maximum is 699 days.
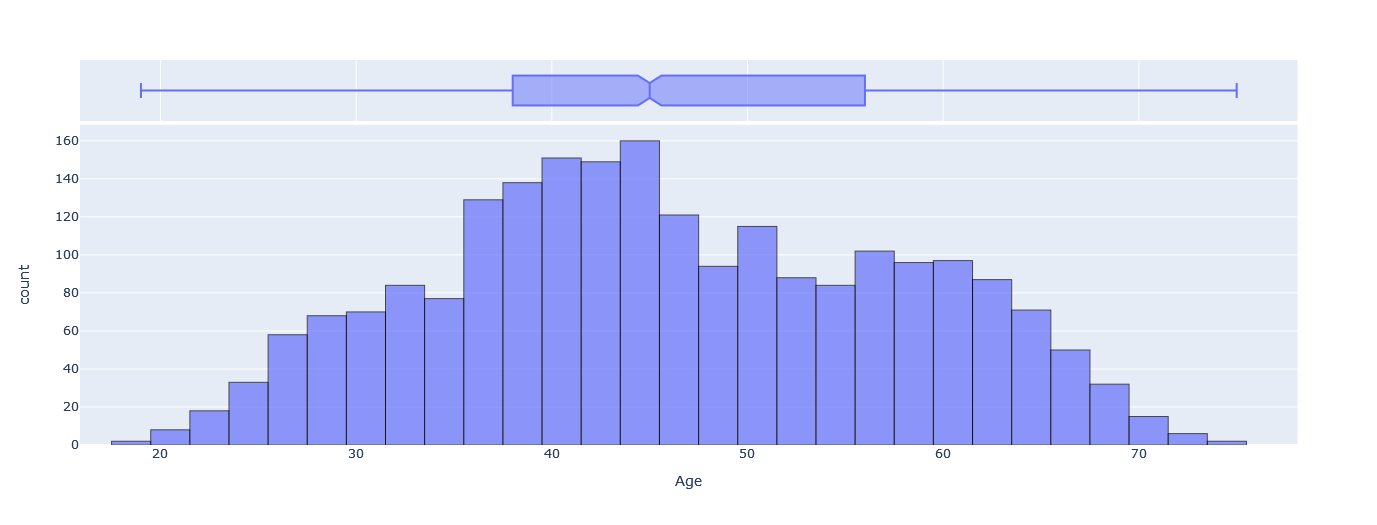
- Age: The mean age of our customers is 46.10, with a standard deviation of 11.71. The youngest customer is 19 years old, while the oldest is 75 years old.
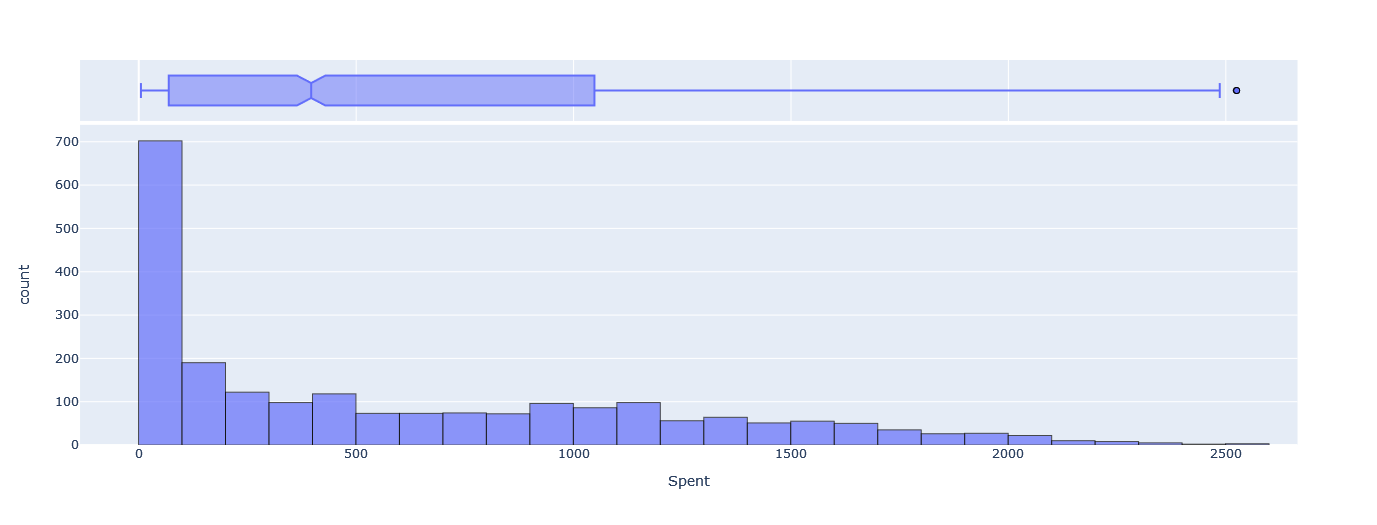
- Spent: The mean amount spent by our customers is $606.82, with a standard deviation of $601.68. The minimum amount spent is $5.00, and the maximum is $2525.00.
- Children: On average, our customers have less than one child (0.95), with a standard deviation of 0.75. The minimum number of children is 0, while the maximum is 3.
- Family Size: The mean family size of our customers is 2.59, with a standard deviation of 0.91. The minimum family size is 1, while the maximum is 5.
We can also visualize the distribution of Age, Income, and Spent using the following plots, where we can notice that for Age and Income, the distributions are approximately symmetrical around the mean, where for Spent, the distribution is highly skewed to the right, with more values in the range of $0 to $100.
Categorical Features:
Next, we will examine the frequency tables for the categorical variables in our dataset:
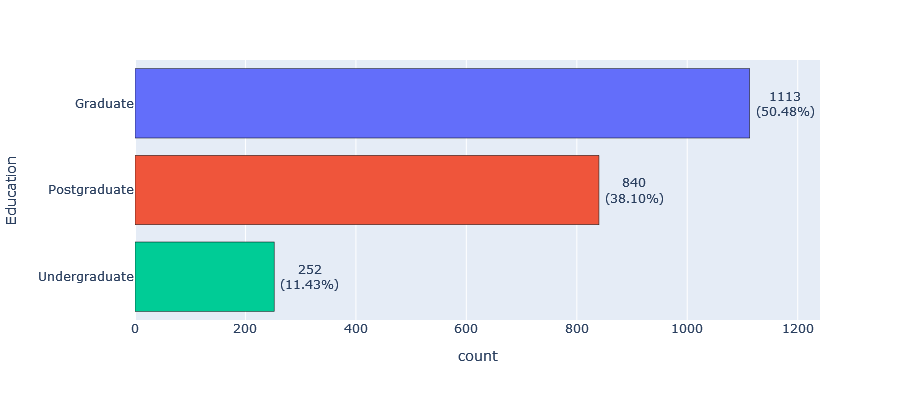
- Education: The majority of our customers (50.48%) have a graduate level of education, followed by 38.10% with a postgraduate level of education and 11.43% with an undergraduate level of education.
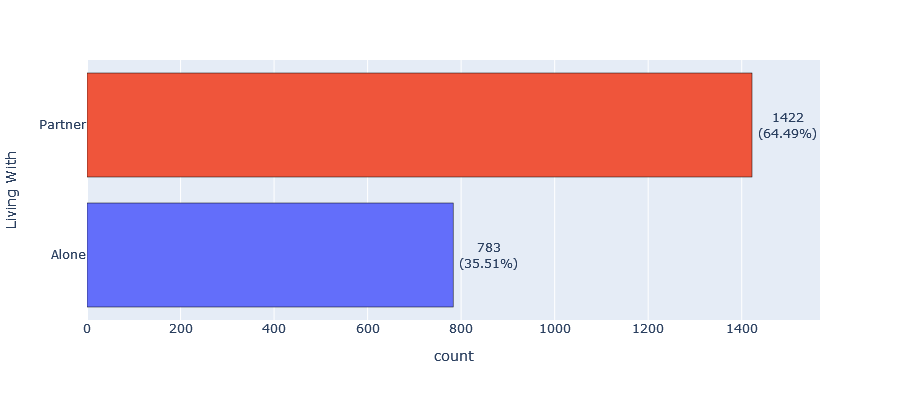
- Living with: Most of our customers (64.49%) live with a partner, while 35.51% live alone.
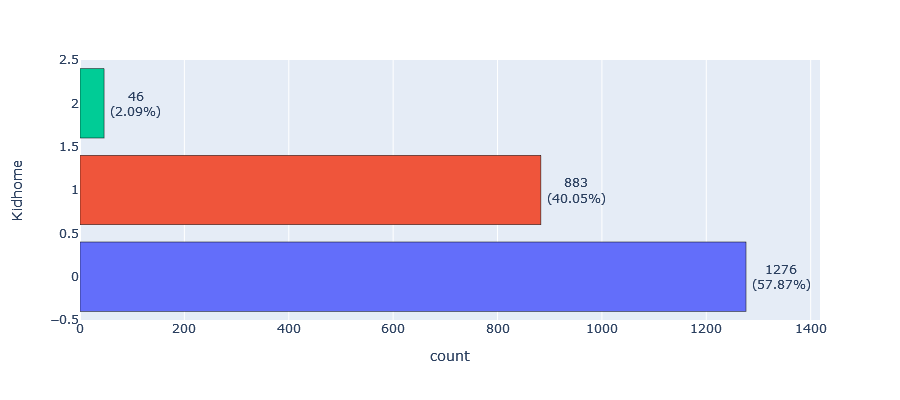
- Kid home: Over half of our customers (57.87%) have no children living at home, while 40.05% have one child and only 2.09% have two children living at home.
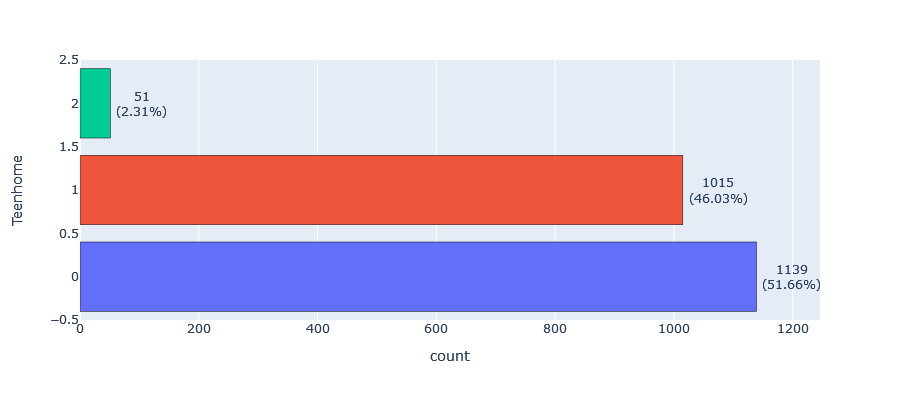
- Teen home: The majority of our customers (51.66%) have no teenagers living at home, while 46.03% have one teenager and only 2.31% have two teenagers living at home.
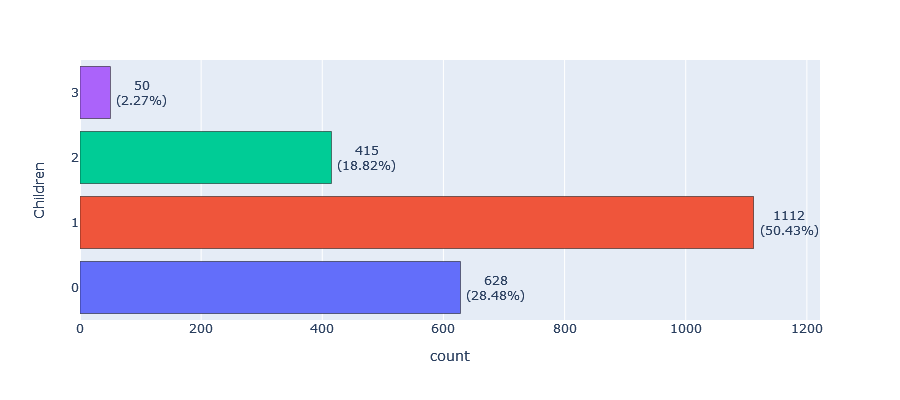
- Children: More than half of our customers (50.43%) have one child, while 28.48% have no children, 18.82% have two children, and only 2.27% have three children.
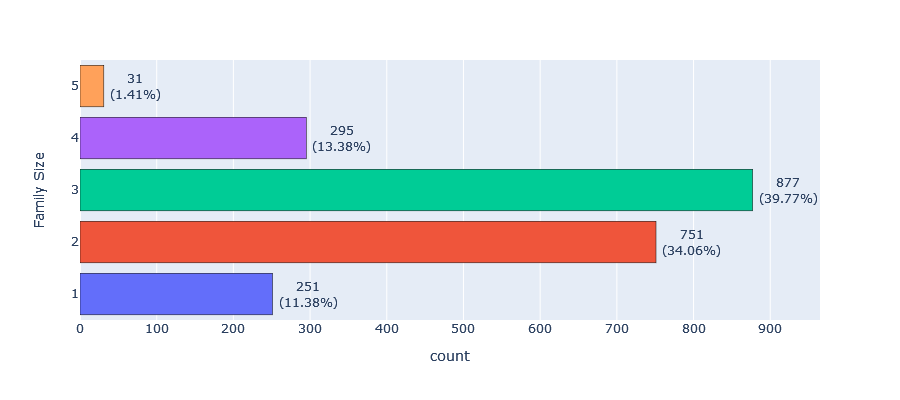
- Family size: The most common family size is three (39.77%), followed by two (34.06%) and four (13.38%).
From the above frequency tables, we can observe that our customers are predominantly educated, with the majority living with a partner and having one child. This information can be useful when creating customer segments based on their demographics.
Relationships between Response and Categorical Features:
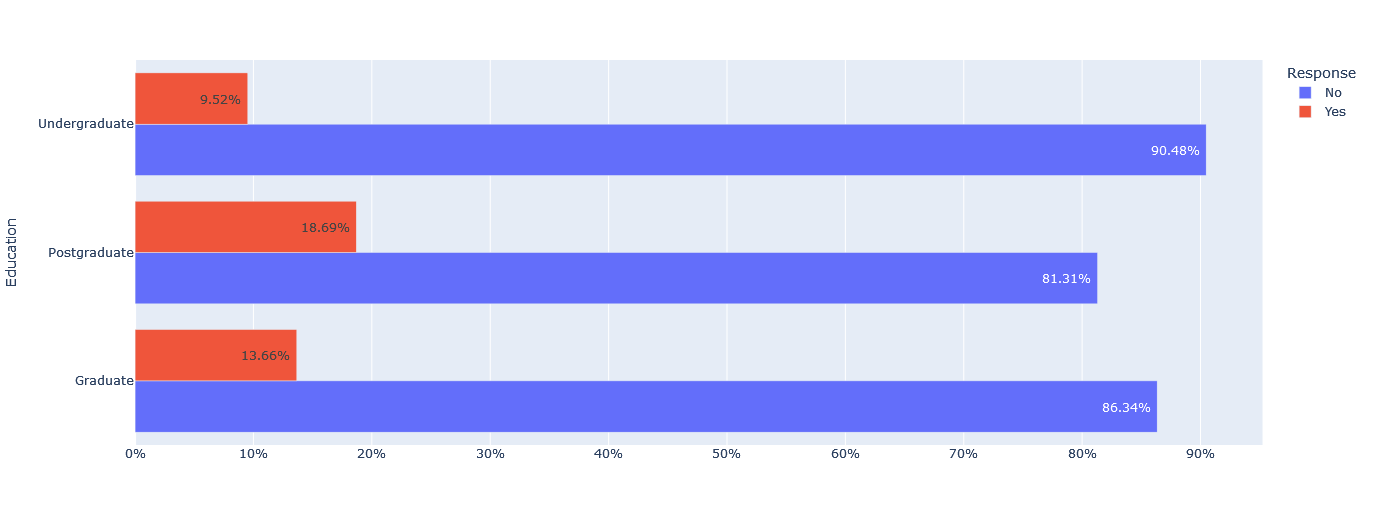
The dataset indicates some interesting relationships between response to the last campaign and other categorical variables. We observe that a large majority of undergraduate, graduated, and postgraduate customers did not respond to the last campaign, with percentages ranging from 81.31% to 90.48%.
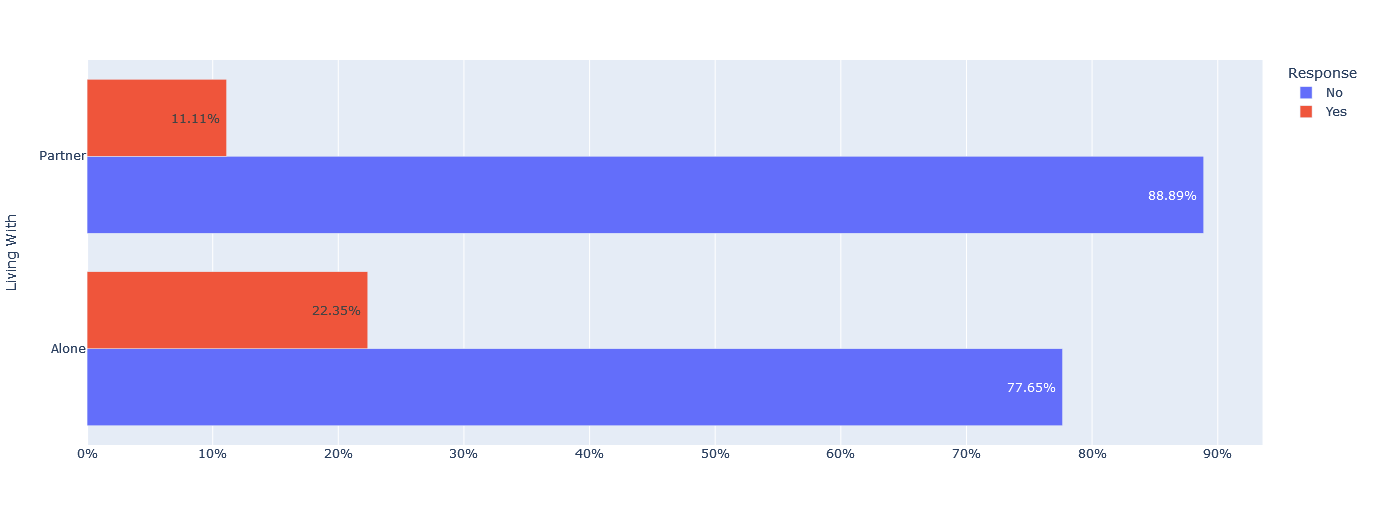
For customers living with a partner, the non-response rate was 88.89%, while 77.65% of customers living alone did not respond.
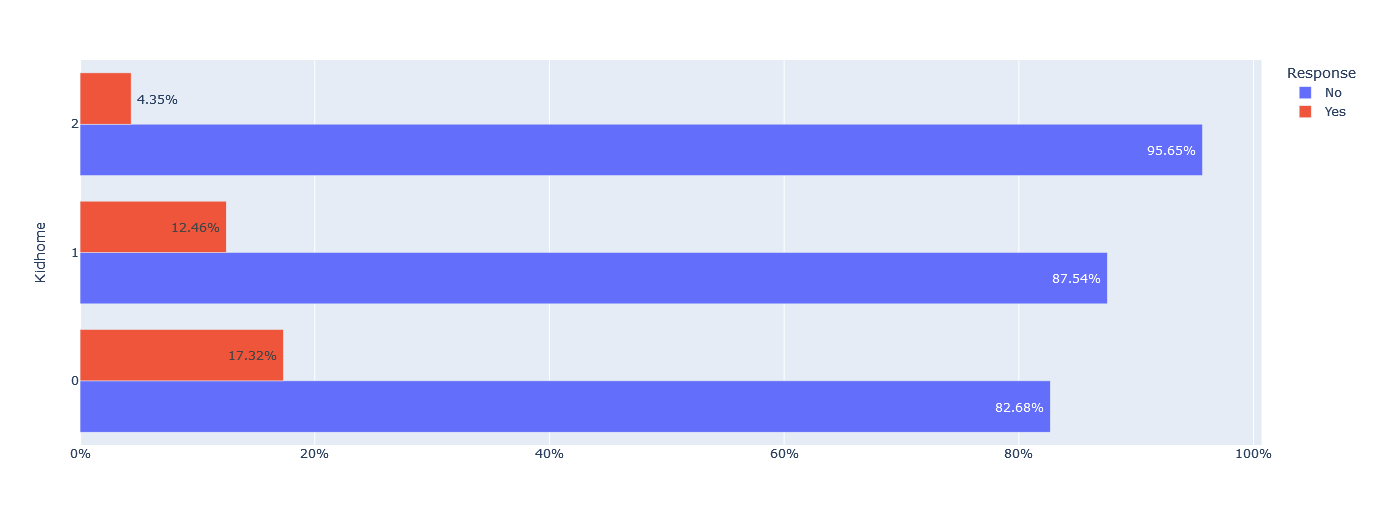
In terms of kid home, the majority of customers (82.68%) with no kids at home did not respond, and the non-response rate increased to 95.65% for customers with two kids at home.
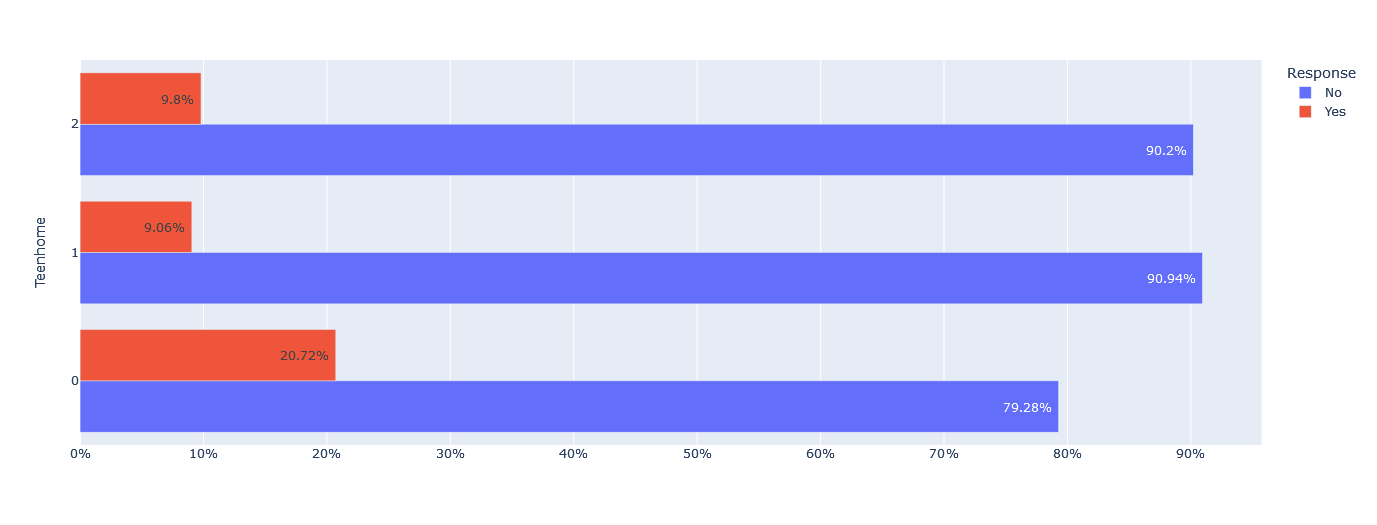
Similarly, about 90% of customers with one or two teenagers at home did not respond, while 79.28% of customers with no teenagers at home did not respond.
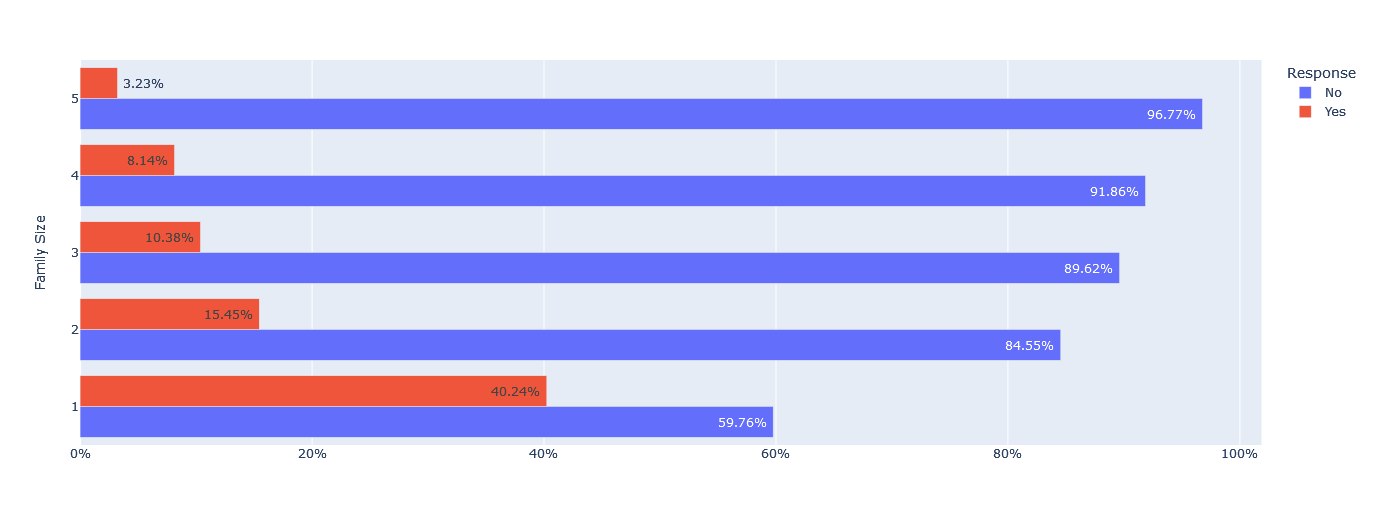
Finally, we observe a decreasing response rate as family size increases, with the response rate dropping from 40.24% for families with size 1 to only 3.23% for families with size 5.
Relationships between Response and Numerical Features:
In analyzing the relationship between the response variable and various numerical variables, it is important to consider how each variable affects the likelihood of a response. The following tables provide insights into the relationship between income, recency, customer tenure, age, and spending with response:
Income: Those who responded to the campaign had a higher mean income of $60,209.68 compared to non-responders who had a mean income of $50,094.50. The Mann-Whitny test indicates that there is a statistically significant difference in income between the two groups (H=60.0157, p=0.0000).
Recency: On average, responders had a lower mean recency score of 35.2643 compared to non-responders who had a mean recency score of 51.4541. The Mann-Whitny test suggests a statistically significant difference between the two groups (p < 0.001).
Customer Tenure: Those who responded to the campaign had a higher mean customer tenure of 448.0811 compared to non-responders who had a mean tenure of 336.9327. The Mann-Whitny test indicates that there is a statistically significant difference in customer tenure between the two groups (p < 0.001).
Age: The mean age for responders was 45.5045, and for non-responders it was 46.2009. The Mann-Whitny test indicates that there is no statistically significant difference in age between the two groups (p=0.2972).
Spending: Those who responded to the campaign had a higher mean spending of $985.6607 compared to non-responders who had a mean spending of $539.4322. The Mann-Whitny test suggests a statistically significant difference in spending between the two groups (p < 0.001).
Overall, these results suggest that income, recency, customer tenure, and spending may play important roles in predicting campaign response, while age may not be as influential.
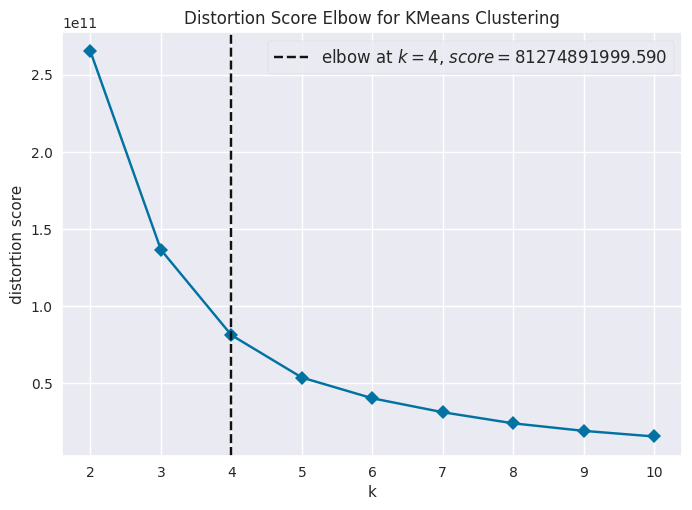
In customer segmentation, we aim to divide customers into groups based on similarities in their behavior, preferences, and characteristics. This allows companies to tailor their marketing strategies and product offerings to better meet the needs of each group, ultimately increasing customer satisfaction and profitability. In this analysis, we used k-means clustering to segment customers based on their demographic information, transaction history, and some other features. Before using the k-means algorithm, the missing values were imputed using simple imputation methods, and we performed linear principal component analysis (PCA) to transform the data into a lower-dimensional space which increase the performance of the model. The elbow method was used to determine the optimal number of clusters, which was found to be four.
The resulting clusters, labeled as Cluster 0, 1, 2, and 3, will be described and relabeled in detail in the following sections.
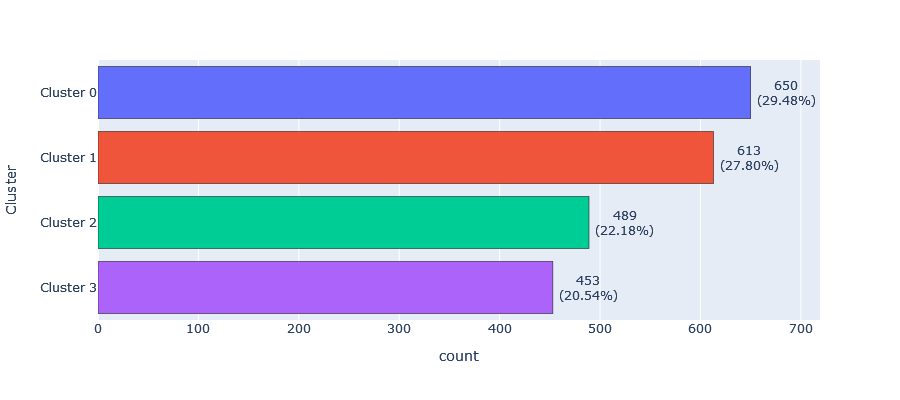
The 4 clusters are distributed as follows:
Cluster 0: This cluster has a frequency of 650, representing 29.48% of the sample.
Cluster 1: This cluster has a frequency of 613, representing 27.80% of the sample.
Cluster 2: This cluster has a frequency of 489, representing 22.18% of the sample.
- Cluster 3: This cluster has a frequency of 453, representing 20.54% of the sample.
Based on the customer segmentation analysis, we have identified four distinct customer clusters. Let’s now look at the profiles of customers in each cluster in terms of their education, parental status, family size, and number of children.
Cluster 0:
- Highly educated, with a majority of postgraduate and graduate degrees (92.15%).
- Mostly parents (90.77%) with a moderate family size of 2-4 members (92.98%).
- The majority of customers have one or two children (96%).
- Almost two-thirds of them have only one Kid at home (62.00%).
- Customers in this cluster have a relatively lower income with a mean of $41,599.
- The average age of customers in this cluster is 46 years old.
- Customers in this cluster have a lower spending amount compared to other clusters, with a mean of $212.
Cluster 1:
- Highly educated, with a majority of postgraduate and graduate degrees (92.8%).
- Mostly parents (79.12%) with a moderate family size of 2-3 members (78.14%).
- The majority of customers have one child (60.85%).
- Almost all of them have no more than two children (98.12%).
- Most of them have no Kid at home (79.45%).
- Customers in this cluster have a higher income with a mean of $60,950.
- The average age of customers in this cluster is 49 years old.
- Customers in this cluster have a moderate spending amount with a mean of $794.
Cluster 2:
- Highly educated, with a majority of graduate degrees (55.83%).
- Mostly non-parents (71.57%) with a small family size of 1-2 members (77.71%).
- The majority of customers have no child (71.57%).
- Most of them have no kid at home (92.64%).
- Customers in this cluster have the highest income with a mean of $79,545.
- The average age of customers in this cluster is 47 years old.
- Customers in this cluster have the highest spending amount compared to other clusters, with a mean of $1,390.
Cluster 3:
- Moderately educated, with a majority of graduate degrees (52.1%).
- Mostly parents (80.13%), with a moderate family size of 2-3 members (80.18%).
- Most of them have one child (62.91%).
- Most of them have one Kid at home (72.41%).
- Customers in this cluster have a relatively lower income with a mean of $23,239.
- The average age of customers in this cluster is 40 years old.
- Customers in this cluster have the lowest spending amount compared to other clusters, with a mean of $74.
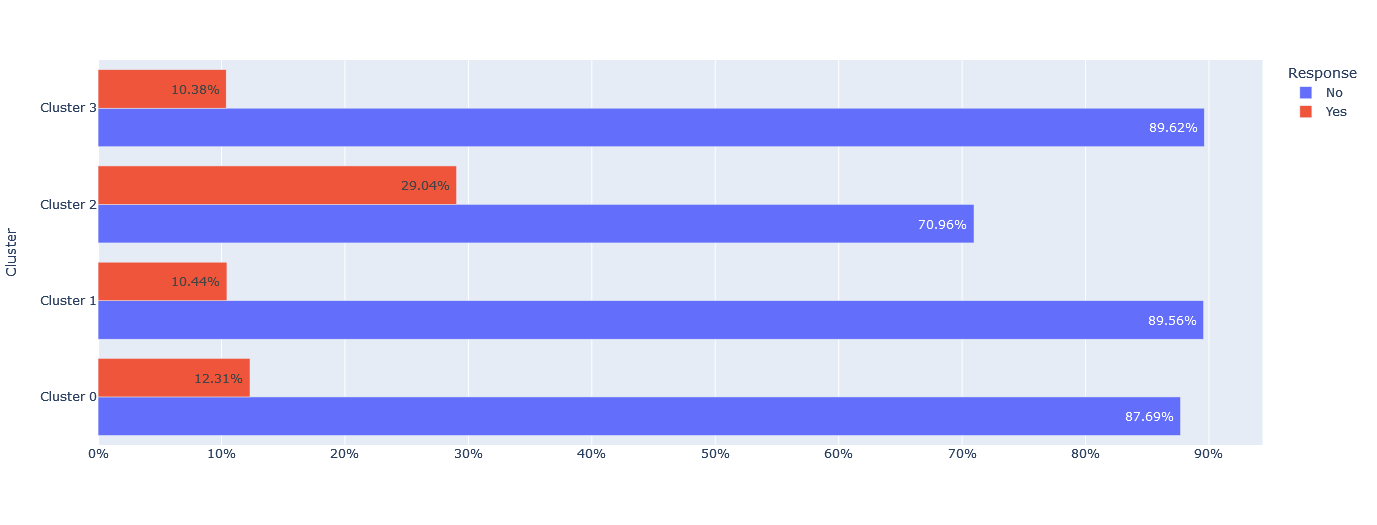
On the other hand, when it comes to the response to the last marketing campaign, Cluster 3 and 1 have the highest percentage of customers who did not respond, with 89.62% and 89.56% respectively. Cluster 2 has the lowest percentage of customers who did not respond, with only 70.96% reporting no response.
Overall, these findings suggest that there may be differences in the customer experience across the four clusters, which could be useful for the company to consider when developing strategies to improve customer satisfaction and engagement.
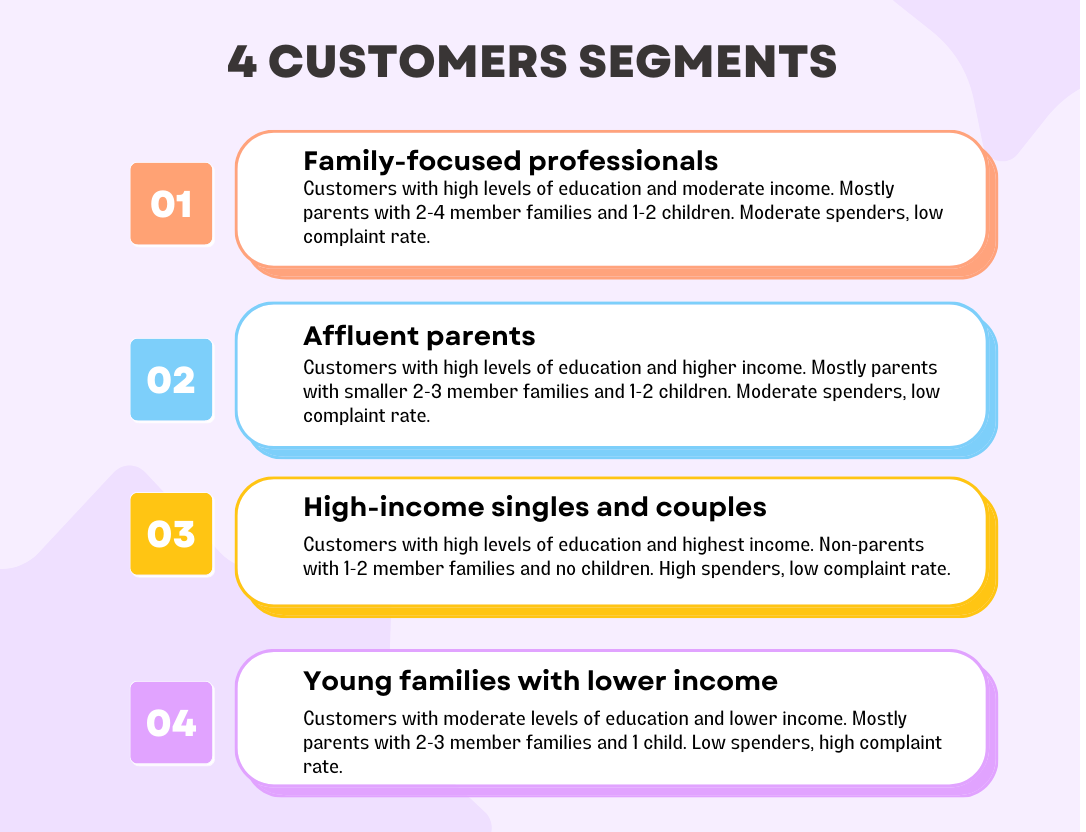
After clustering the dataset of customers based on their demographic and spending information, four distinct groups emerged with unique characteristics. Each cluster is defined by different levels of education, family size, income, age, and spending habits. In order to better understand and communicate the key characteristics of each group, it is helpful to give them appropriate names. By naming these clusters, it becomes easier to refer to them and discuss their specific attributes, which can help in creating targeted marketing strategies or improving business operations to better meet the needs of each group. In this context, we will assign names to each cluster based on their distinctive characteristics:
- Cluster 0 – Family-focused professionals:
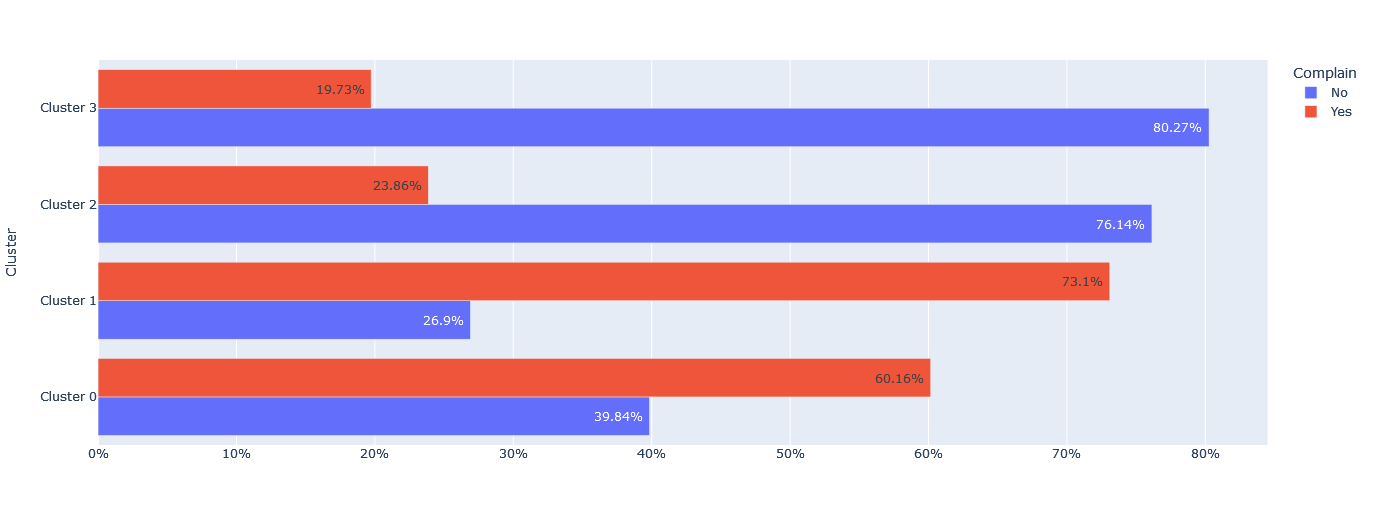
Customers with high levels of education and moderate income. Mostly parents with 2-4 member families and 1-2 children. Moderate spenders, low complaint rate.
- Cluster 1 – Affluent parents:
Customers with high levels of education and higher income. Mostly parents with smaller 2-3 member families and 1-2 children. Moderate spenders, low complaint rate.
- Cluster 2 – High-income singles and couples:
Customers with high levels of education and highest income. Non-parents with 1-2 member families and no children. High spenders, low complaint rate.
- Cluster 3 – Young families with lower income:
Customers with moderate levels of education and lower income. Mostly parents with 2-3 member families and 1 child. Low spenders, high complaint rate.