Age:
We started our analysis by examining the basic descriptive statistics of the dataset. The mean age in the dataset is 43.28 years, with a median of 41 years and a standard deviation of 12.33 years. The age variable had a minimum value of 18 years and a maximum value of 99 years.
We created a histogram to visualize the distribution of the age variable, which showed that the age distribution is roughly normal, with the majority of the customers falling in the 30-50 age range.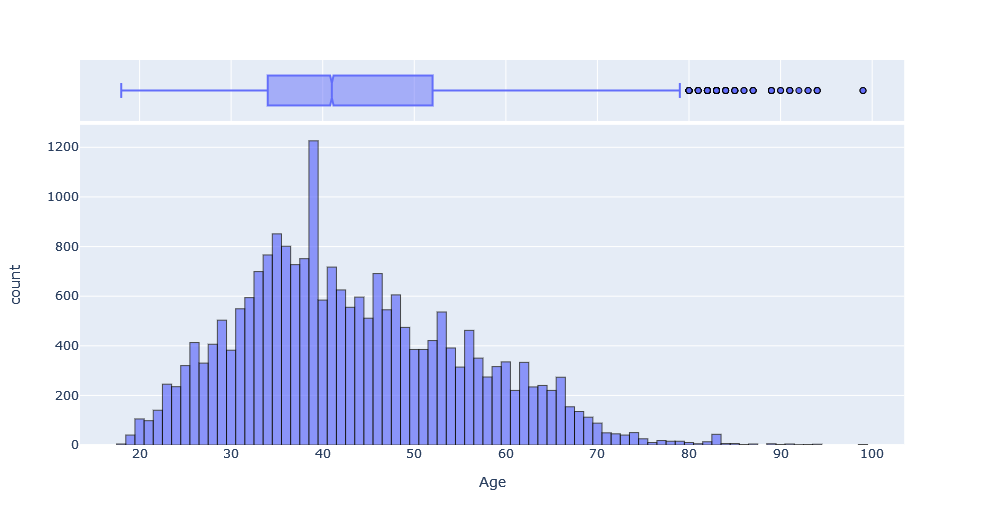
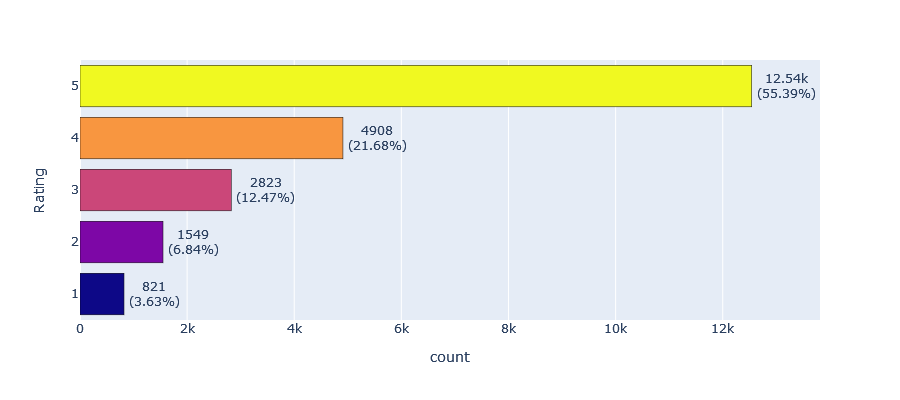
Ratings:
The ratings for the store are generally good, with 12,540 five-star ratings, 4,908 four-star ratings, 2,823 three-star ratings, 1,549 two-star ratings, and 821 one-star ratings.
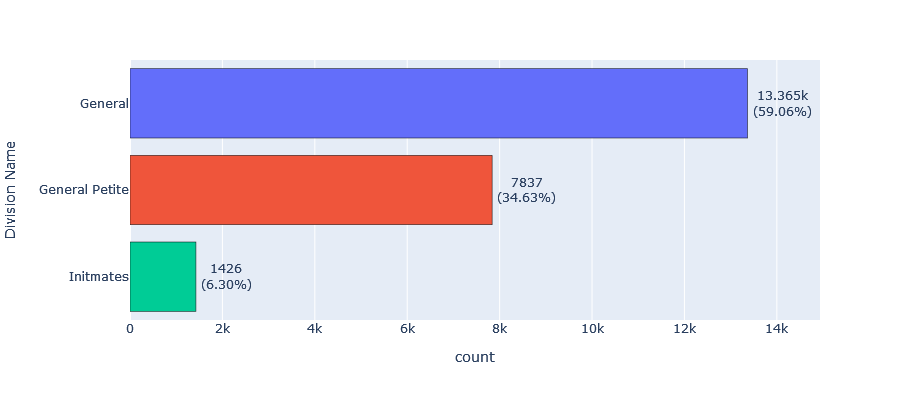
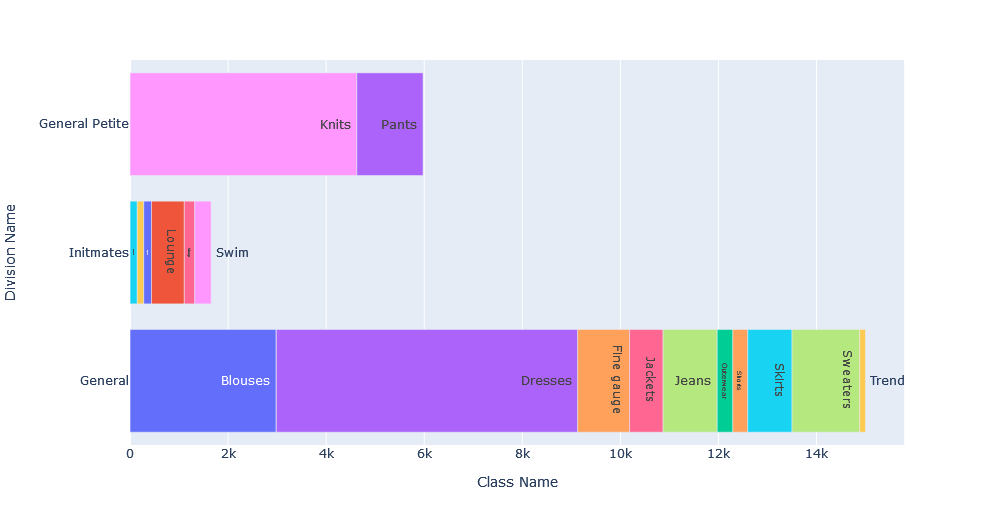
Division:
The division with the highest sales is General with 13,365 sales, followed by General Petite with 7,837 sales, and Intimates with 1,426 sales.
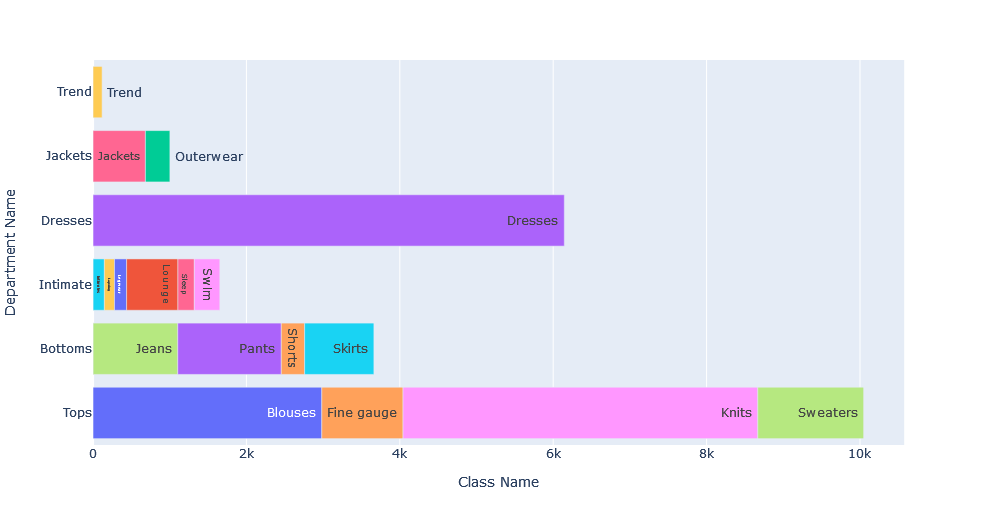
Department:
The department with the highest number of sales is Tops with 10,048 sales, followed by Dresses with 6,145 sales, then Bottoms with 3,662, Intimates with 1,653, Jackets with 1,002, and lastly Trend with 118 sales.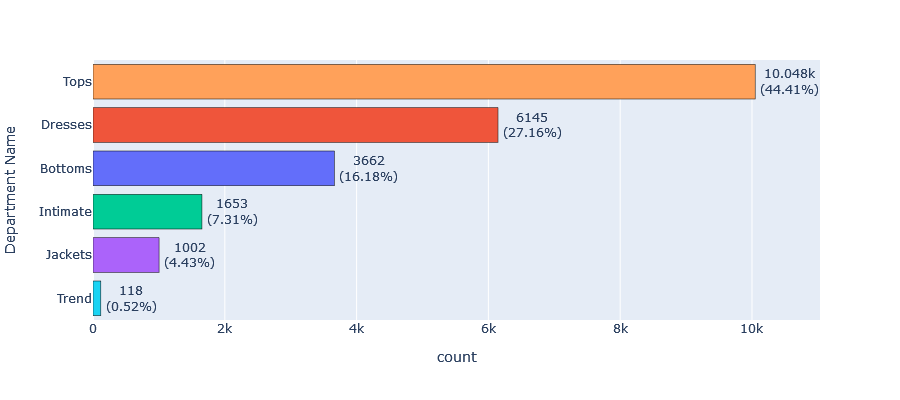
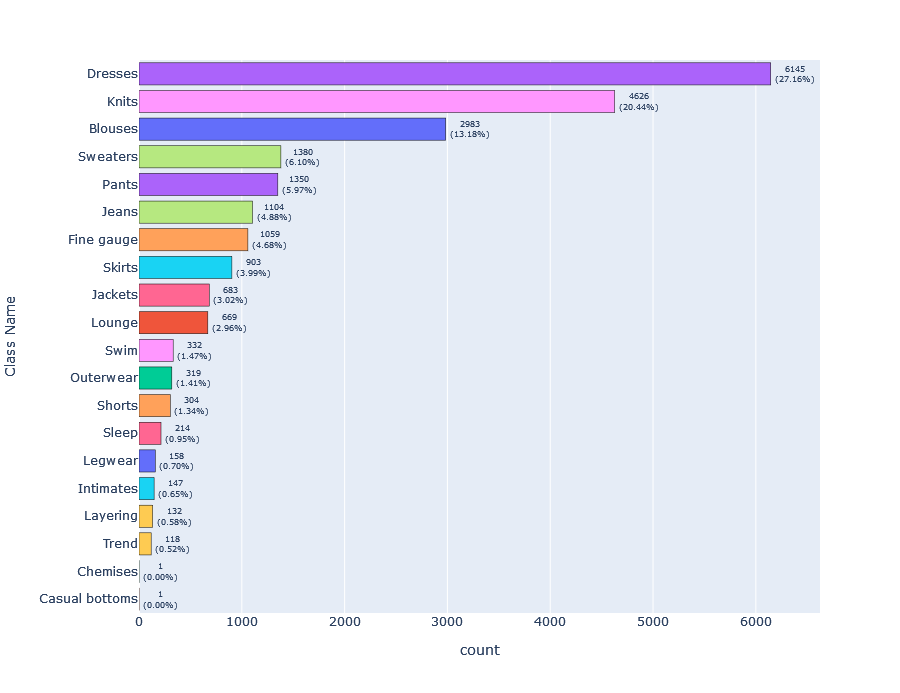
Class:
The class with the highest sales is Dresses with 6,145, followed by Knits with 4,626, and in the last place, we have Trend with 118 sales.
Class by Division & Department:
Afterward, we generated clustered bar graphs to depict the classes offered in each Division and Department. These graphs aided us in comprehending the comparative prevalence of each class within its corresponding Division or Department.
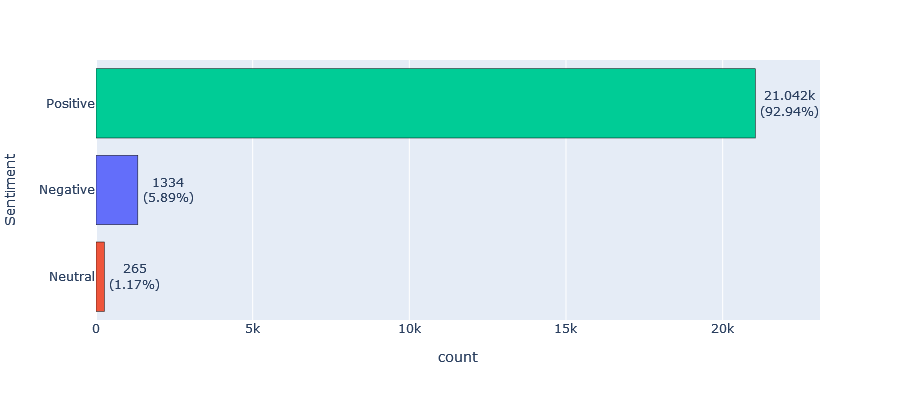
Sentiment Variable:
In order to extract more insights about the customers’ opinions towards the products offered by the online store, sentiment analysis was conducted using Vedar. This tool allows for the analysis of the text review variable in terms of positive, negative, and neutral sentiments.
The sentiment analysis showed that out of the 22,641 transactions, the majority of customers expressed positive sentiment towards the products with 21,042 transactions or 92.94% of the total transactions having positive sentiment. 1,334 transactions or 5.89% had negative sentiment, and 265 transactions or 1.17% had neutral sentiment.
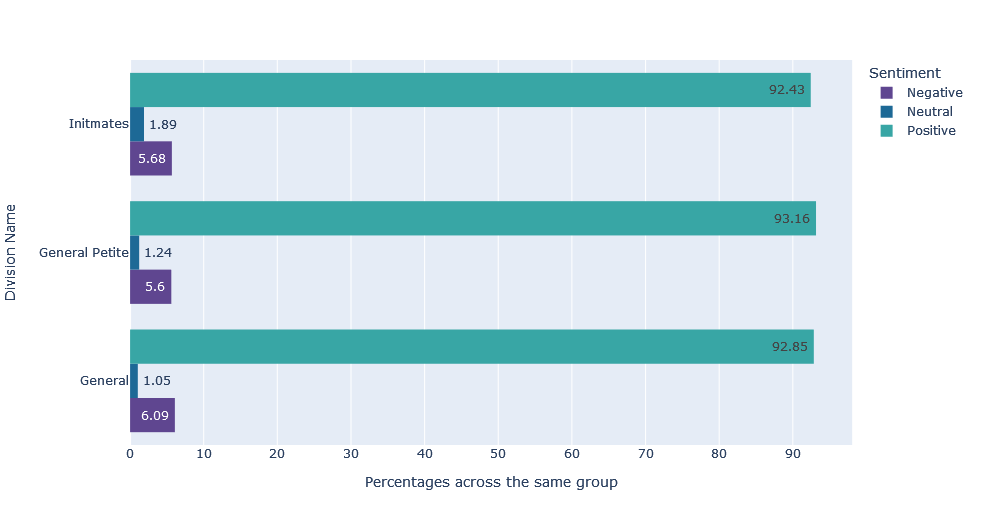
Sentiment by Division & Department:
In order to visualize these findings, two side-by-side bar charts were created to show the distributions of positive, negative, and neutral sentiment across different departments and divisions. The charts indicated that there were no significant differences in the percentage of sentiments across the different departments and divisions, except for the trend department. We found that the trend department had a lower percentage of positive sentiments compared to other departments, which is a cause for concern.
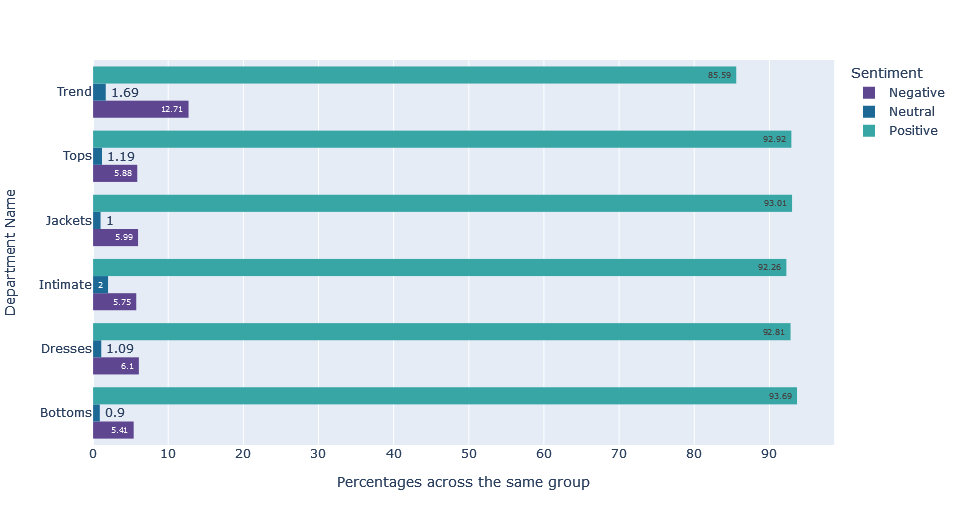
One possible reason for the lower percentage of positive sentiment in the trend department could be that the trend products in the department are not meeting the expectations of the target customers. This could be due to the design, quality, or pricing of the products not resonating well with the audience. Another reason could be that the department is not marketing their products effectively or targeting the right audience.
To address these issues, what I did suggest is that the online store could conduct further research to identify the specific pain points of the trend department’s customers and adjust their product design, quality, or pricing accordingly.
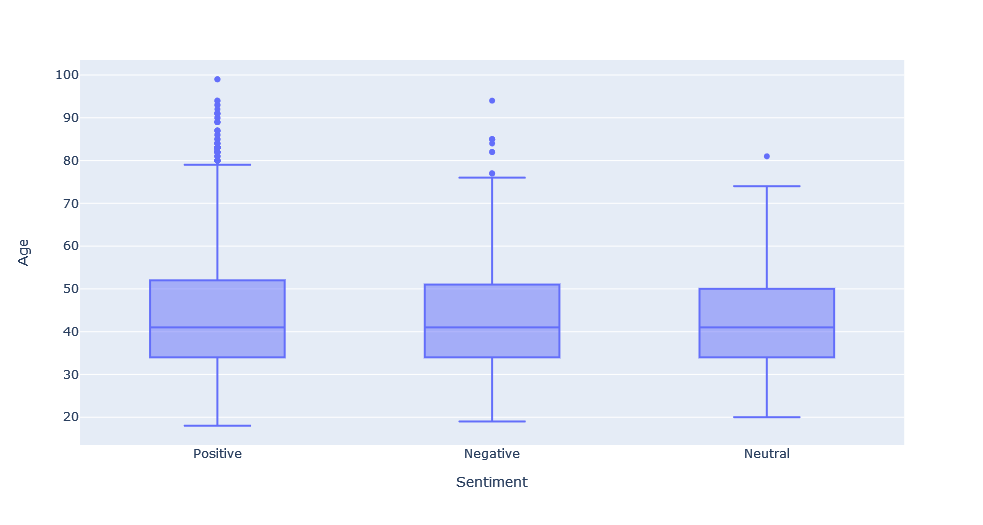
Age VS Sentiment:
To examine the relationship between age and sentiment, a brief statistical analysis was conducted using basic descriptive statistics, a side-by-side boxplot and a Kruskal-Wallis test (the assumptions for the ANOVA test were not all verified). The results showed that there was no significant difference in age between customers with positive, negative, or neutral sentiment. The p-value for the test was 0.7506, which is not significant and lead to conclude the non-difference in sentiment between ages.
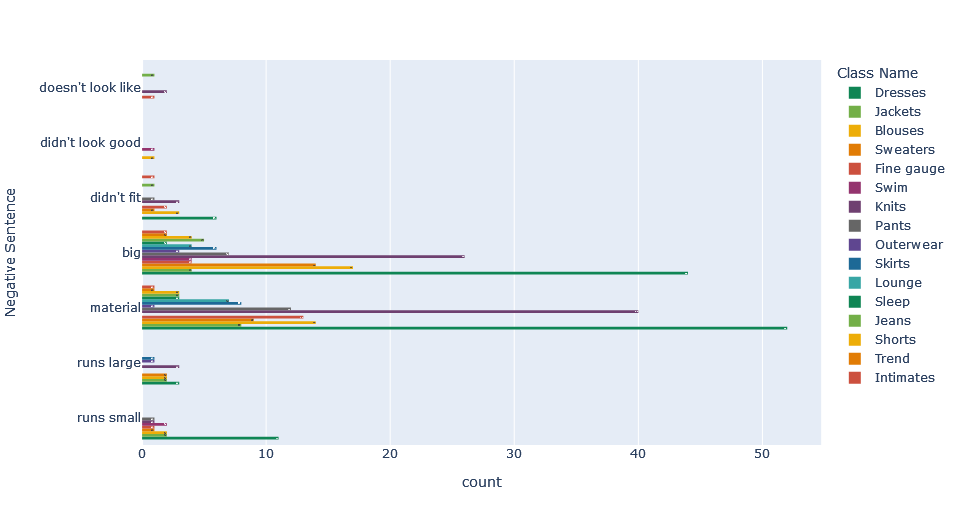
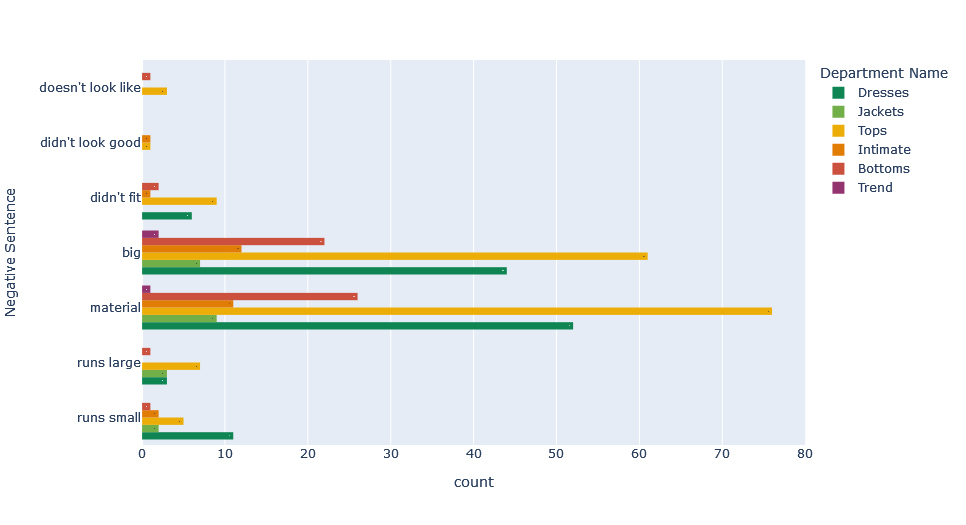
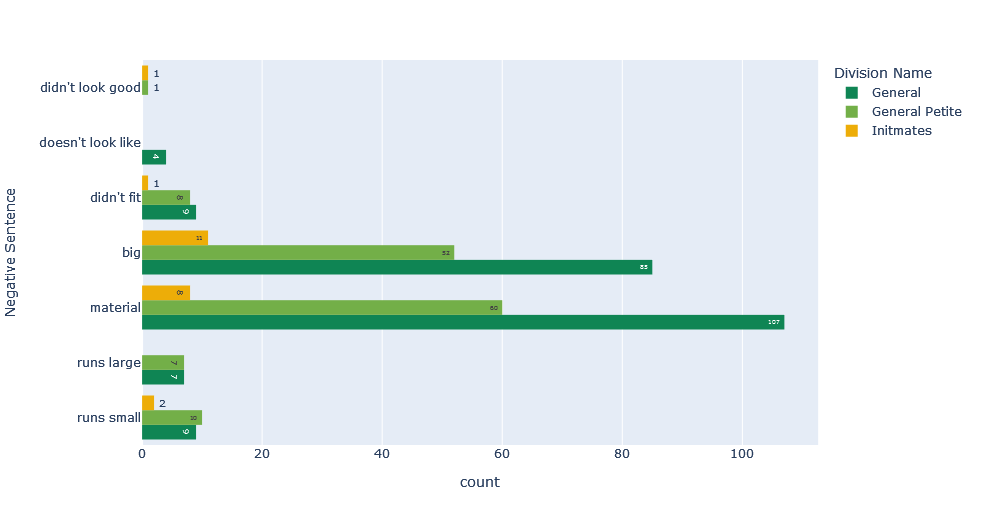
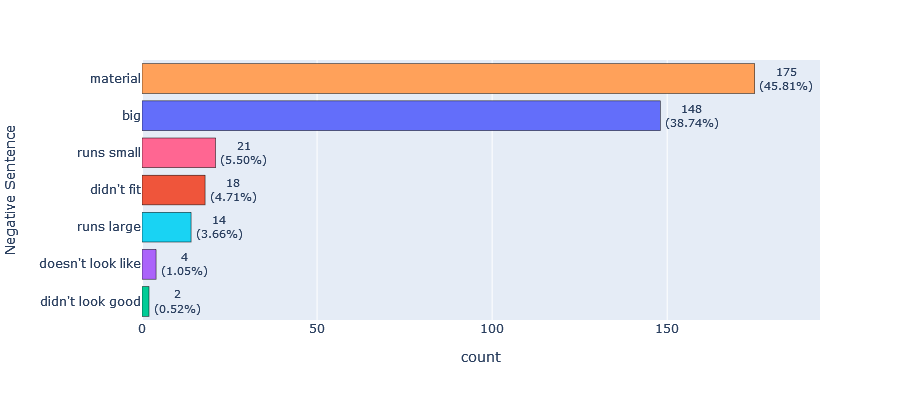
In this section, we will discuss the results of our text mining analysis. Our objective was to extract the most frequently used words and phrases from the customer reviews to identify any recurring issues or areas of concern. By analyzing 1-gram, 2-gram, and 3-gram word combinations, we identified several common negative sentiments expressed by customers.
Our findings suggest that the most significant issue customers face is with the sizing of our products. Negative phrases such as “runs small” and “runs large” were frequently mentioned in the reviews. Other common negative phrases included “material,” “big,” “didn’t fit,” “didn’t look good,” and “doesn’t look like.”
To further investigate the issue, we created side-by-side bar charts to examine which classes, divisions, and departments have the highest occurrence of these negative phrases. The analysis revealed that dresses and knits had the highest occurrence of these negative phrases. This information can help us pinpoint the areas that need improvement and take corrective actions to improve customer satisfaction.